Bureau of Economic Analysis
Activities of U.S. Multinational Enterprises, 2023
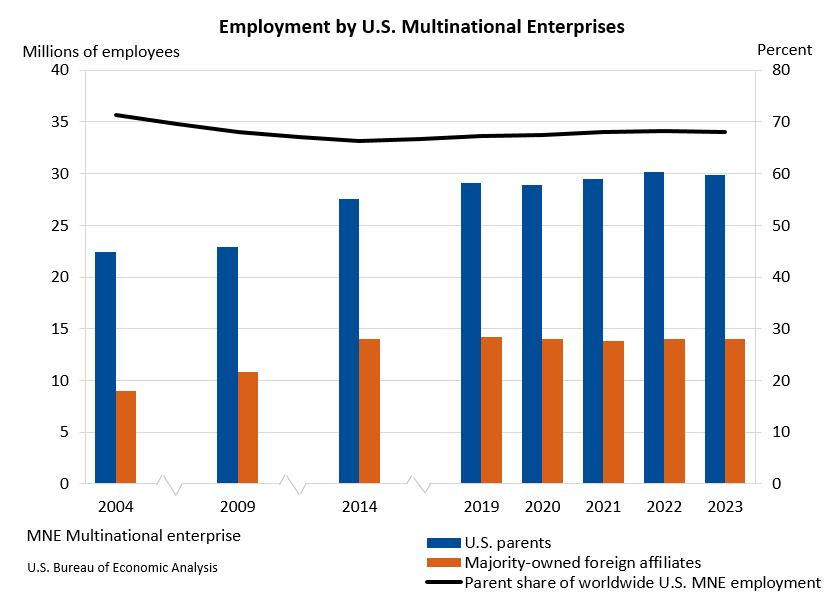
Worldwide employment by U.S. multinational enterprises decreased 0.4 percent to 43.9 million workers in 2023 (preliminary) from 44.1 million workers in 2022 (revised), according to statistics released today by the U.S. Bureau of Economic Analysis on the operations and finances of U.S. parent companies and their foreign affiliates.
Principal Federal Economic Indicators
Noteworthy
- 2025 News Release Schedule
- Innovation at BEA
- 2025 Annual Updates
- Distribution of Personal Income Nowcast
- New! Services Trade Data for More Countries
- Data Tool: Trade in Value Added
- Updated: RIMS II Regional Multipliers
- Arts and Culture
- Space Economy
- FDI Now in State BEARFACTS
- Quick Guide: Price Indexes
The Latest
Gross Domestic Product by State: 4th Quarter 2019
Real gross domestic product (GDP) increased in 48 states and the District of Columbia in the fourth quarter of 2019. The percent change in real GDP in the fourth quarter ranged from 3.4 percent in Washington and Utah to -0.1 percent in West Virginia.
Gross Domestic Product by State: 4th Quarter and Annual 2019
Real gross domestic product (GDP) increased in 48 states and the District of Columbia in the fourth quarter of 2019. The percent change in real GDP in the fourth quarter ranged from 3.4 percent in Washington and Utah to -0.1 percent in West Virginia.
Gross Domestic Product by Industry: Fourth Quarter 2019
Retail trade, finance and insurance, and utilities were the leading contributors to the increase in U.S. economic growth in the fourth quarter of 2019. Overall, 17 of 22 industry groups contributed to the 2.1 percent increase in real GDP in the fourth quarter.
Gross Domestic Product by Industry: Fourth Quarter and Year 2019
Retail trade, finance and insurance, and utilities were the leading contributors to the increase in U.S. economic growth in the fourth quarter of 2019. Overall, 17 of 22 industry groups contributed to the 2.1 percent increase in real GDP in the fourth quarter.
February 2020 Trade Gap is $39.9 Billion
The U.S. monthly international trade deficit decreased in February 2020 according to the U.S. Bureau of Economic Analysis and the U.S. Census Bureau. The deficit decreased from $45.5 billion in January (revised) to $39.9 billion in February, as imports decreased more than exports. The previously published January deficit was $45.3 billion. The goods deficit decreased $5.9 billion in February to $61.2 billion. The services surplus decreased $0…
U.S. International Trade in Goods and Services, February 2020
The U.S. monthly international trade deficit decreased in February 2020 according to the U.S. Bureau of Economic Analysis and the U.S. Census Bureau. The deficit decreased from $45.5 billion in January (revised) to $39.9 billion in February, as imports decreased more than exports. The previously published January deficit was $45.3 billion. The goods deficit decreased $5.9 billion in February to $61.2 billion. The services surplus decreased $0.4…
U.S. International Investment Position Year 2019
The U.S. net international investment position, the difference between U.S. residents’ foreign financial assets and liabilities, was –$10.99 trillion at the end of 2019, according to statistics released by the U.S. Bureau of Economic Analysis (BEA). Assets totaled $29.32 trillion and liabilities were $40.31 trillion. At the end of 2018, the net investment position was –$9.55 trillion.
U.S. International Investment Position Fourth Quarter 2019
The U.S. net international investment position, the difference between U.S. residents’ foreign financial assets and liabilities, was –$10.99 trillion at the end of the fourth quarter of 2019, according to statistics released by the U.S. Bureau of Economic Analysis (BEA). Assets totaled $29.32 trillion and liabilities were $40.31 trillion. At the end of the third quarter, the net investment position was –$10.98 trillion.
U.S. International Investment Position, Fourth Quarter and Year 2019
The U.S. net international investment position, the difference between U.S. residents’ foreign financial assets and liabilities, was –$10.99 trillion at the end of the fourth quarter of 2019, according to statistics released by the U.S. Bureau of Economic Analysis (BEA). Assets totaled $29.32 trillion and liabilities were $40.31 trillion. At the end of the third quarter, the net investment position was –$10.98 trillion.
Deputy Director Bohman Takes on Duties as Acting Director
The Bureau of Economic Analysis (BEA) announced today that Deputy Director Mary Bohman is the acting Director of the Bureau, overseeing the production of official economic statistics that provide a comprehensive, up-to-date picture of the U.S. economy.


