
Bureau of Economic Analysis
Gross Domestic Product, 2nd Quarter 2025 (Second Estimate) and Corporate Profits (Preliminary)
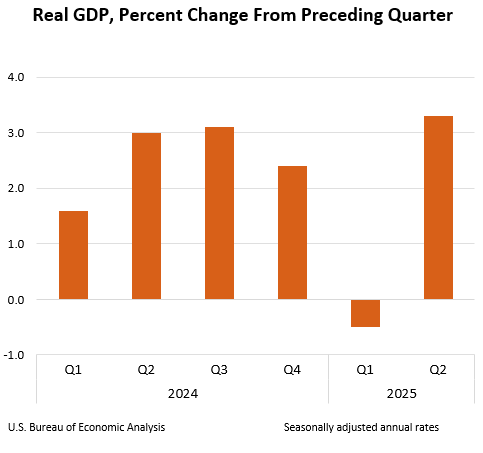
Real gross domestic product (GDP) increased at an annual rate of 3.3 percent in the second quarter of 2025 (April, May, and June), according to the second estimate released by the U.S. Bureau of Economic Analysis. In the first quarter, real GDP decreased 0.5 percent. The increase in real GDP in the second quarter primarily reflected a decrease in imports, which are a subtraction in the calculation of GDP, and an increase in consumer spending. These movements were partly offset by decreases in investment and exports.
Principal Federal Economic Indicators
Noteworthy
- 2025 News Release Schedule
- Innovation at BEA
- 2025 Annual Updates
- Distribution of Personal Income Nowcast
- New! Services Trade Data for More Countries
- Data Tool: Trade in Value Added
- Updated: RIMS II Regional Multipliers
- Arts and Culture
- Space Economy
- FDI Now in State BEARFACTS
- Quick Guide: Price Indexes


The Latest
Nondurable Goods Manufacturing Led Growth in the Fourth Quarter Gross Domestic Product by Industry
Nondurable goods manufacturing was the leading contributor to U.S. economic growth in the fourth quarter of 2014. Both private goods- and services-producing sectors contributed to the increase, while the government sector decreased. Overall, 15 of 22 industry groups contributed to the 2.2 percent increase in real GDP.
Gross Domestic Product by Industry, 4th quarter and annual 2014
Nondurable goods manufacturing; professional, scientific, and technical services; and mining were the leading contributors to U.S. economic growth in the fourth quarter of 2014, according to statistics on the breakout of GDP by industry released today by the Bureau of Economic Analysis (BEA). Both the private goods- and services-producing sectors contributed to the increase, while the government sector decreased. Overall, 15 of 22 industry…
BEA Tool Allows Businesses to Estimate the Economic Impact of Disasters
When a disaster strikes, understanding the economic impact on the affected community is a key to developing a recovery plan. BEA’s regional input-output modeling, RIMS II, provides disaster recovery officials a tool to model the impact on an affected community.
Timelier, more accurate data: the Commerce Department's statistical agencies deliver on promise of better data for better decision-making
The Economics and Statistics Administration’s family of statistical agencies – the Bureau of Economic Analysis (BEA) and U.S. Census Bureau – are announcing an important new initiative that will lead to an acceleration of key trade data as well as improved accuracy of the advance estimate of Gross Domestic Product (GDP). GDP is widely considered the most important measure of the U.S. economy.
February 2015 Trade Gap is $35.4 Billion
The U.S. monthly international trade deficit decreased in February 2015 according to the U.S. Bureau of Economic Analysis and the U.S. Census Bureau. The deficit decreased from $42.7 billion in January (revised) to $35.4 billion in February, as imports decreased more than exports. The previously published January deficit was $41.8 billion. The goods deficit decreased $7.4 billion from January to $55.2 billion in February. The services surplus…
Advance Trade Data Aim to Improve First Estimate of Quarterly GDP
The Census Bureau’s plans to produce an advance monthly report on international trade in goods will allow the Bureau of Economic Analysis to incorporate three months of official trade data into its first estimate of quarterly Gross Domestic Product, helping to improve the accuracy of this major economic measure.
BEA Director Brian Moyer praised the move as an example of cross-agency collaboration.
U.S. International Trade in Goods and Services, February 2015
U.S. Census Bureau U.S. Bureau of Economic Analysis NEWS U.S. Department of Commerce * Washington, DC 20230 U.S. INTERNATIONAL TRADE IN GOODS AND SERVICES February 2015 The U.S. Census Bureau and the U.S.
Value of U.S. Liabilities Increased More Than U.S. Assets in Fourth Quarter
The U.S. net international investment position was -$6,915.3 billion (preliminary) at the end of the fourth quarter of 2014 as the value of U.S. liabilities exceeded the value of U.S. assets. At the end of the third quarter, the net position was -$6,129.4 billion (revised).
Value of U.S. Liabilities Increased More than U.S. Assets in 2014
The U.S. net international investment position was -$6,915.3 billion (preliminary) at the end of 2014 as the value of U.S. liabilities exceeded the value of U.S. assets. At the end of 2013, the net position was -$5,383.0 billion.
U.S. International Investment Position, 4th quarter 2014
Notice About the 2015 Annual Revision of the U.S. Net International Investment Position
The annual revision of the U.S. net international investment position will be released along with preliminary estimates for the first quarter of 2015 on June 30, 2015. An article previewing the annual revisions will appear in the April 2015 issue of the Survey of Current Business.