Bureau of Economic Analysis
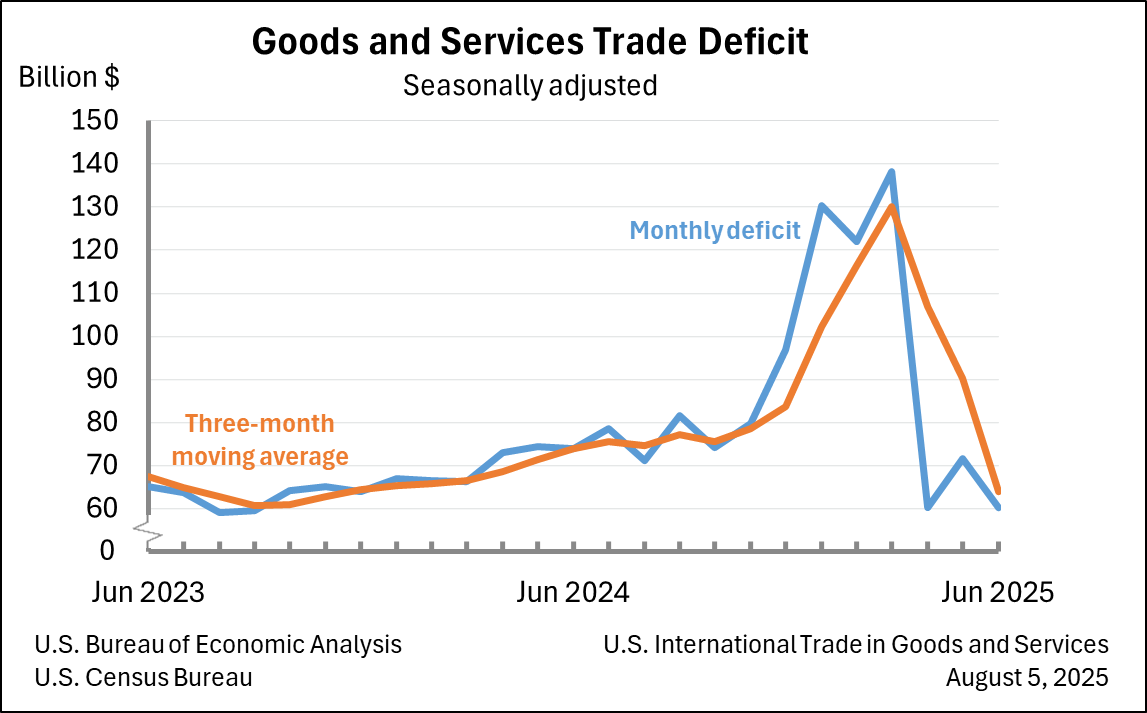
U.S. International Trade in Goods and Services, June 2025
The U.S. goods and services trade deficit decreased in June 2025 according to the U.S. Bureau of Economic Analysis and the U.S. Census Bureau. The deficit decreased from $71.7 billion in May (revised) to $60.2 billion in June, as exports decreased less than imports. The goods deficit decreased $11.4 billion in June to $85.9 billion. The services surplus increased $0.1 billion in June to $25.7 billion.
Principal Federal Economic Indicators
Noteworthy
- 2025 News Release Schedule
- Innovation at BEA
- 2025 Annual Updates
- New! Services Trade Data for More Countries
- Data Tool: Trade in Value Added
- Distribution of State Personal Income
- Updated: RIMS II Regional Multipliers
- Arts and Culture
- Space Economy
- FDI Now in State BEARFACTS
- Quick Guide: Price Indexes
The Latest
Personal Income by County and Metropolitan Area, 2022
In 2022, personal income, in current dollars, increased in 1,964 counties, decreased in 1,107, and was unchanged in 43. Personal income increased 2.1 percent in the metropolitan portion of the United States and 1.3 percent in the nonmetropolitan portion.
September 2023 Trade Gap is $61.5 Billion
The U.S. goods and services trade deficit increased from $58.7 billion in August (revised) to $61.5 billion in September, as imports increased more than exports. The goods deficit increased $1.7 billion to $86.3 billion, and the services surplus decreased $1.2 billion to $24.8 billion.
U.S. International Trade in Goods and Services, September 2023
The U.S. monthly international trade deficit increased in September 2023 according to the U.S. Bureau of Economic Analysis and the U.S. Census Bureau. The deficit increased from $58.7 billion in August (revised) to $61.5 billion in September as imports increased more than exports. The goods deficit increased $1.7 billion in September to $86.3 billion. The services surplus decreased $1.2 billion in September to $24.8 billion.
Personal Income and Outlays, September 2023
Personal income increased $77.8 billion (0.3 percent at a monthly rate) in September. Disposable personal income — personal income less personal current taxes— increased $56.1 billion (0.3 percent). Personal outlays—the sum of personal consumption expenditures, personal interest payments, and personal current transfer payments—increased $175.1 billion (0.9 percent) and consumer spending increased $138.7 billion (0.7 percent). Personal saving…
Personal Income and Outlays, September 2023
Personal income increased $77.8 billion (0.3 percent at a monthly rate) in September. Disposable personal income (DPI)—personal income less personal current taxes— increased $56.1 billion (0.3 percent). Personal outlays—the sum of personal consumption expenditures (PCE), personal interest payments, and personal current transfer payments—increased $175.1 billion (0.9 percent) and consumer spending increased $138.7 billion (0.7 percent). Personal…
Gross Domestic Product, Third Quarter 2023 (Advance)
Real gross domestic product (GDP) increased at an annual rate of 4.9 percent in the third quarter of 2023, according to the “advance” estimate. In the second quarter, real GDP increased 2.1 percent. The increase in the third quarter primarily reflected increases in consumer spending and inventory investment. Imports, which are a subtraction in the calculation of GDP, increased.
Gross Domestic Product, Third Quarter 2023 (Advance Estimate)
Real gross domestic product (GDP) increased at an annual rate of 4.9 percent in the third quarter of 2023, according to the “advance” estimate. In the second quarter, real GDP increased 2.1 percent. The increase in the third quarter primarily reflected increases in consumer spending and inventory investment. Imports, which are a subtraction in the calculation of GDP, increased.
New Statistics Show Distribution of Personal Income Within States
Statistics for every state and the District of Columbia were added today to BEA’s prototype statistics on the distribution of U.S. personal income. This provides a new tool for assessing how households share in each state’s economic growth.
Measures of Economic Well-Being Updated With Complementary Open-Source Notebook
The Bureau of Economic Analysis updated its prototype measures of economic well-being and growth today and for the first time released open-source code that allows users to tailor the charts and tables to meet their needs.
The prototype measures package some of BEA’s headline statistics with data from other statistical agencies to spotlight trends in well-being and the drivers of economic growth.
Gross Domestic Product for American Samoa, 2022
Real gross domestic product (GDP) for American Samoa increased 1.8 percent in 2022 after decreasing 0.8 percent in 2021. The increase in real GDP reflected increases in government spending and exports. Personal consumption expenditures, private fixed investment, and private inventory investment subtracted from growth. Imports, a subtraction item in the calculation of GDP, also decreased.


