
Bureau of Economic Analysis
U.S. International Trade in Goods and Services, September 2025
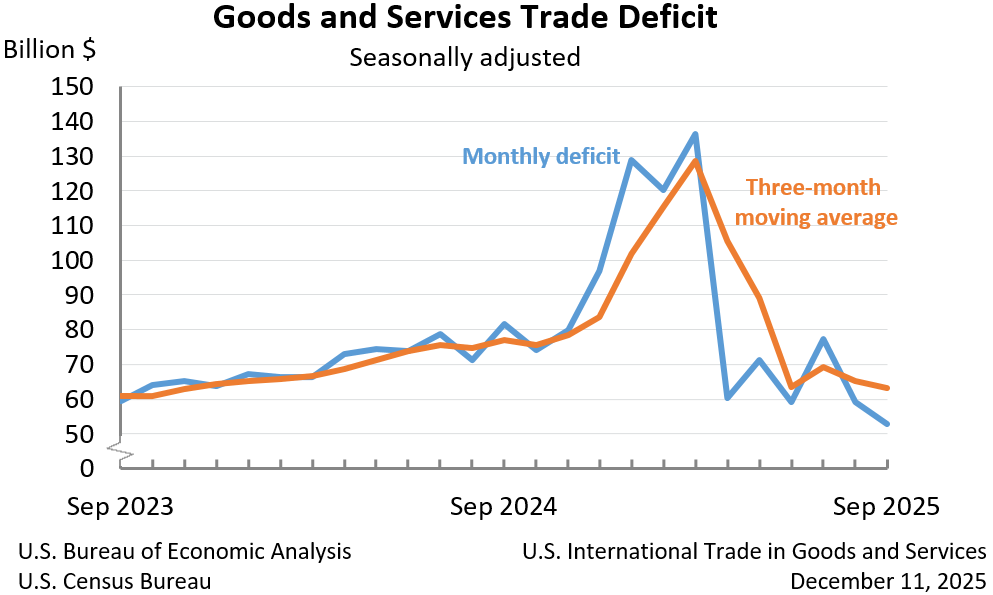
The U.S. goods and services trade deficit decreased in September 2025 according to the U.S. Bureau of Economic Analysis and the U.S. Census Bureau. The deficit decreased from $59.3 billion in August (revised) to $52.8 billion in September, as exports increased more than imports. The goods deficit decreased $7.1 billion in September to $79.0 billion. The services surplus decreased $0.6 billion in September to $26.2 billion.
Principal Federal Economic Indicators
Noteworthy


The Latest
Arts and Cultural Production Satellite Account
This release is available as a PDF download.
Spending on Arts and Cultural Production Continues to Increase
Nominal value added from all arts and cultural production (ACP) industries- a measure of this sector’s contribution to gross domestic product (GDP) – increased 3.8 percent, or $25.8 billion in 2012, according to new statistics released by the Bureau of Economic Analysis (BEA). Value added for ACP accounted for 4.3 percent, or $698.7 billion, of GDP.
November 2014 Trade Gap is $39.0 Billion
The U.S. monthly international trade deficit decreased in November 2014 according to the U.S. Bureau of Economic Analysis and the U.S. Census Bureau. The deficit decreased from $42.2 billion in October (revised) to $39.0 billion in November, as imports decreased more than exports. The previously published October deficit was $43.4 billion. The goods deficit decreased $3.3 billion from October to $58.3 billion in November. The services surplus…
2015 Promises More Data from BEA on Foreign Investment in the United States
Are you looking for statistics on new investment by foreign companies in the United States? The Bureau of Economic Analysis (BEA) has you covered. New statistics slated to be unveiled later this year will provide information on things like when a foreign company launches a new business in this country or expands an existing one by building a new plant.
U.S. International Trade in Goods and Services, November 2014
U.S. Census Bureau U.S. Bureau of Economic Analysis NEWS U.S. Department of Commerce * Washington, DC 20230 U.S. INTERNATIONAL TRADE IN GOODS AND SERVICES November 2014 The U.S. Census Bureau and the U.S.
Value of U.S. Assets Decreased and Value of U.S. Liabilities Increased in Third Quarter 2014
The U.S. net international investment position was -$6,157.9 billion (preliminary) at the end of the third quarter of 2014 as the value of U.S. liabilities exceeded the value of U.S. assets. At the end of the second quarter, the net position was -$5,475.4 billion (revised).
U.S. International Investment Position, 3rd quarter 2014
The U.S. net international investment position at the end of the third quarter of 2014 was -$6,157.9 billion (preliminary) as the value of U.S. liabilities exceeded the value of U.S. assets (chart 1, table 1). At the end of the second quarter of 2014, the net position was -$5,475.4 billion (revised). The $682.5 billion decrease in the net position reflected a $362.4 billion decrease in the value of U.S. assets and a $320.2 billion increase…
GDP Increases in Third Quarter: "Third" Estimate of GDP
Real gross domestic product (GDP) increased 5.0 percent in the third quarter of 2014, according to the “third” estimate released by the Bureau of Economic Analysis. In the second quarter, real GDP increased 4.6 percent.
GDP highlights The increase in GDP in the third quarter reflected the following:
Real Consumer Spending Rose in November
Personal income rose 0.4 percent in November after rising 0.3 percent in October. Wages and salaries, the largest component of personal income, rose 0.5 percent in November after rising 0.3 percent in October.
Current-dollar disposable personal income (DPI), after-tax income, rose 0.3 percent in November, the same increase as in October.
Real DPI, income adjusted for taxes and inflation, increased 0.5 percent in November…
Personal Income and Outlays, November 2014
Personal income increased $54.4 billion, or 0.4 percent, and disposable personal income (DPI) increased $42.4 billion, or 0.3 percent, in November, according to the Bureau of Economic Analysis. Personal consumption expenditures (PCE) increased $67.9 billion, or 0.6 percent. In October, personal income increased $49.8 billion, or 0.3 percent, DPI increased $39.7 billion, or 0.3 percent, and PCE increased $31.3 billion, or 0.3 percent, based on…