June 30, 2025

U.S. International Investment Position, 1st Quarter 2025 and Annual Update

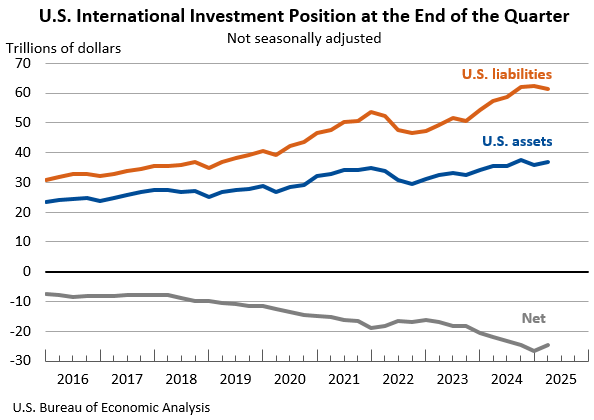
The U.S. net international investment position, the difference between U.S. residents’ foreign financial assets and liabilities, was -$24.61 trillion at the end of the first quarter of 2025, according to statistics released today by the U.S. Bureau of Economic Analysis. Assets totaled $36.85 trillion, and liabilities were $61.47 trillion. At the end of the fourth quarter of 2024, the net investment position was -$26.54 trillion (revised).
Principal Federal Economic Indicators

Gross Domestic Product
Q1 2025 (3rd)
-0.5%
Personal Income
May 2025
-0.4%
International Trade in Goods and Services
April 2025
-$61.6 B
International Transactions
Q1 2025
-$450.2 B

Noteworthy

The Latest

State Quarterly Personal Income, 4th quarter 2016; State Annual Personal Income, 2016 (preliminary estimates)

March 28, 2017 | News Release

State personal income grew on average 3.6 percent in 2016, after increasing 4.5 percent in 2015, according to estimates released today by the Bureau of Economic Analysis. Growth of state personal income—the sum of net earnings by place of residence, property income, and personal current transfer receipts—ranged from –1.7 percent in Wyoming to 5.9 percent in Nevada (table 1).

U.S. Current-Account Deficit Decreases in Fourth Quarter 2016

March 21, 2017 | The BEA Wire

The U.S. current-account deficit decreased to $112.4 billion (preliminary) in the fourth quarter of 2016 from $116.0 billion (revised) in the third quarter of 2016. As a percentage of U.S. GDP, the deficit decreased to 2.4 percent from 2.5 percent. The previously published current-account deficit for the third quarter was $113.0 billion.

U.S. International Transactions, 4th quarter and Year 2016

March 21, 2017 | News Release

The U.S. current-account deficit decreased to $112.4 billion (preliminary) in the fourth quarter of 2016 from $116.0 billion (revised) in the third quarter of 2016, according to statistics released by the Bureau of Economic Analysis (BEA). The deficit decreased to 2.4 percent of current-dollar gross domestic product (GDP) from 2.5 percent in the third quarter.

Travel and Tourism Satellite Account: Fourth Quarter 2016

March 15, 2017 | The BEA Wire

Real spending (output) on travel and tourism turned down in the fourth quarter of 2016, decreasing at an annual rate of 3.3 percent after increasing 3.7 percent (revised) in the third quarter according to new statistics released by the Bureau of Economic Analysis.

Travel and Tourism Satellite Accounts, 4th quarter 2016

March 15, 2017 | News Release

Real spending (output) on travel and tourism turned down in the fourth quarter of 2016, decreasing at an annual rate of 3.3 percent after increasing 3.7 percent (revised) in the third quarter according to new statistics released by the Bureau of Economic Analysis. In contrast, real gross domestic product (GDP) increased 1.9 percent in the fourth quarter after increasing 3.5 percent in the third. For the year, travel and tourism grew 2.3…

October 2015

March 13, 2017 | Survey of Current Business

Upcoming in the Survey of Current Business Direct Investment

Statistics on investment positions, international transactions, and the composition of investments of U.S. and foreign multinational enterprises.

Gross Domestic Product by State

Quarterly statistics for the first quarter of 2015 and 2006–2014 that show economic growth across states.

January 2017 Trade Gap is $48.5 Billion

March 7, 2017 | The BEA Wire

The U.S. monthly international trade deficit increased in January 2017 according to the U.S. Bureau of Economic Analysis and the U.S. Census Bureau. The deficit increased from $44.3 billion in December (revised) to $48.5 billion in January, as imports increased more than exports. The previously published December deficit was $44.3 billion. The goods deficit increased $4.0 billion in January to $69.7 billion. The services surplus decreased $0.3…

U.S. International Trade In Goods And Services, January 2017

March 7, 2017 | News Release

ERRATA Exhibits 20 and 20b in the “U.S. International Trade in Goods and Services: January 2017” report were updated on March 22, 2017, to correct statistics for services trade with Saudi Arabia, OPEC, and the "All other countries" grouping for all quarters of 2016 and for annual 2016. The release text and relevant tables in “U.S. Trade in Goods and Services by Selected Countries and Areas, 1999-present” were also updated to reflect this…

Real Consumer Spending Falls in January

March 1, 2017 | The BEA Wire

Personal income increased 0.4 percent in January after increasing 0.3 percent in December. Wages and salaries, the largest component of personal income, increased 0.4 percent in January, the same increase as in December.

Personal Income and Outlays, January 2017

March 1, 2017 | News Release

Personal income increased $63.0 billion (0.4 percent) in January according to estimates released today by the Bureau of Economic Analysis. Disposable personal income (DPI) increased $40.1 billion (0.3 percent) and personal consumption expenditures (PCE) increased $22.2 billion (0.2 percent). Real DPI decreased 0.2 percent in January and Real PCE decreased 0.3 percent. The PCE price index increased 0.4 percent.