Bureau of Economic Analysis
U.S. International Trade in Goods and Services, July 2025
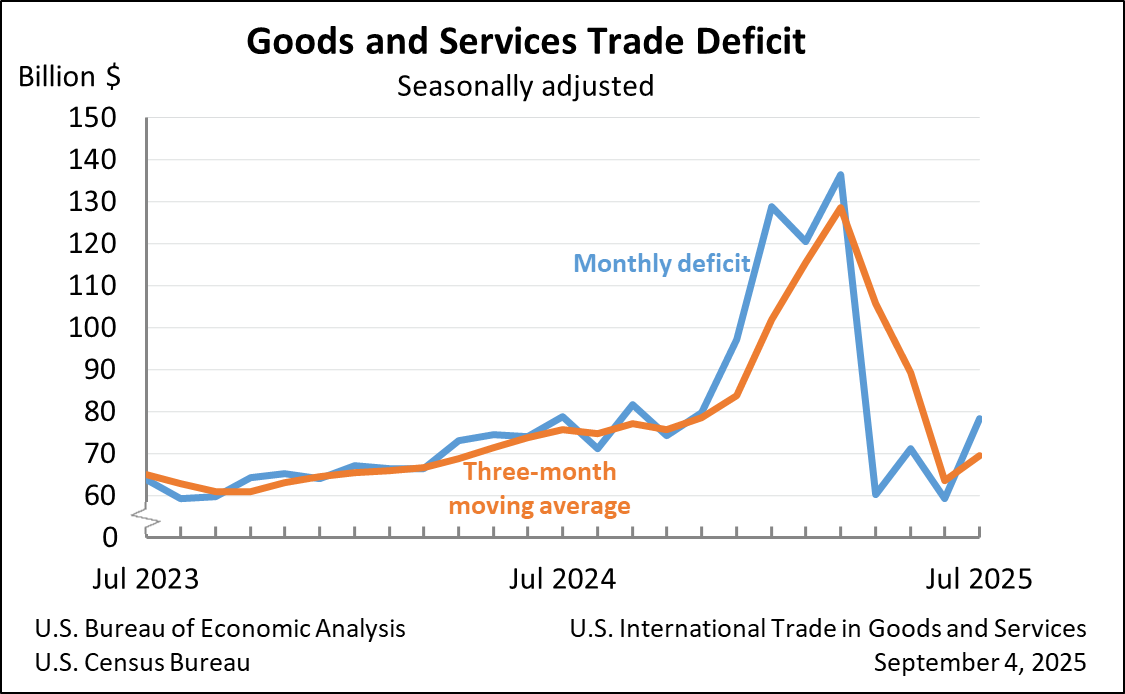
The U.S. goods and services trade deficit increased in July 2025 according to the U.S. Bureau of Economic Analysis and the U.S. Census Bureau. The deficit increased from $59.1 billion in June (revised) to $78.3 billion in July, as imports increased more than exports. The goods deficit increased $18.2 billion in July to $103.9 billion. The services surplus decreased $1.1 billion in July to $25.6 billion.
Principal Federal Economic Indicators
Noteworthy
The Latest
April 2018 Trade Gap is $46.2 Billion
The U.S. monthly international trade deficit decreased in April 2018 according to the U.S. Bureau of Economic Analysis and the U.S. Census Bureau. The deficit decreased from $47.2 billion in March (revised) to $46.2 billion in April, as exports increased and imports decreased. The previously published March deficit was $49.0 billion. The goods deficit decreased $1.0 billion in April to $68.3 billion. The services surplus decreased less than $0.1…
U.S. International Trade in Goods and Services, annual update
In this release and in the accompanying "U.S. International Trade in Goods and Services: April 2018" release (FT-900), the U.S. Census Bureau and the U.S. Bureau of Economic Analysis (BEA) are publishing revised statistics on trade in goods and services. With these releases, statistics on trade in goods on a Census basis are revised beginning with 2015, and statistics on trade in goods on a balance of payments (BOP) basis and on trade…
U.S. International Trade in Goods and Services, April 2018
The U.S. monthly international trade deficit decreased in April 2018 according to the U.S. Bureau of Economic Analysis and the U.S. Census Bureau. The deficit decreased from $47.2 billion in March (revised) to $46.2 billion in April, as exports increased and imports decreased. The previously published March deficit was $49.0 billion. The goods deficit decreased $1.0 billion in April to $68.3 billion. The services surplus decreased less than $0.1…
BEA Releases for the First Time Detailed Data on More than 200 Medical Conditions
The Bureau of Economic Analysis for the first time released statistics that provide information on how much Americans spend to treat more than 200 specific medical conditions, such as acute myocardial infarctions, chronic kidney disease, and osteoarthritis.
The new statistics, which cover the years 2000 through 2014, are part of BEA’s Health Care Satellite Account created in 2015. The project offers a new way of analyzing health care…
Real Disposable Personal Income Increases in April
Personal income increased 0.3 percent in April after increasing 0.2 percent in March. Wages and salaries, the largest component of personal income, increased 0.4 percent in April after increasing 0.2 percent in March.
Personal Income and Outlays, April 2018
Personal income increased 0.3 percent in April after increasing 0.2 percent in March. Wages and salaries, the largest component of personal income, increased 0.4 percent in April after increasing 0.2 percent in March.
GDP Increases in First Quarter
Real gross domestic product (GDP) increased 2.2 percent in the first quarter of 2018, according to the “second” estimate released by the Bureau of Economic Analysis. The growth rate was 0.1 percentage point lower than the “advance” estimate released in April. In the fourth quarter of 2017, real GDP rose 2.9 percent.
Gross Domestic Product: First Quarter 2018 (Second Estimate)
Real gross domestic product (GDP) increased 2.2 percent in the first quarter of 2018, according to the “second” estimate released by the Bureau of Economic Analysis. The growth rate was 0.1 percentage point lower than the “advance” estimate released in April. In the fourth quarter of 2017, real GDP rose 2.9 percent.
Real Personal Income for States, 2016
The percent change in real state personal income ranged from 3.3 percent in Utah and Georgia to -3.6 percent in Wyoming. In the District of Columbia, real personal income grew 4.5 percent.
Real Personal Income for States and Metropolitan Areas, 2016
Real state personal income grew on average 1.1 percent in 2016, after increasing 4.7 percent in 2015. The percent change in real state personal income ranged from 3.3 percent in Utah and Georgia to -3.6 percent in Wyoming. In the District of Columbia, real personal income grew 4.5 percent. Across metropolitan areas, the percent change ranged from 6.6 percent in Jacksonville, NC to -8.1 percent in Midland, TX and Odessa, TX.


