Bureau of Economic Analysis
New Foreign Direct Investment in the United States, 2024
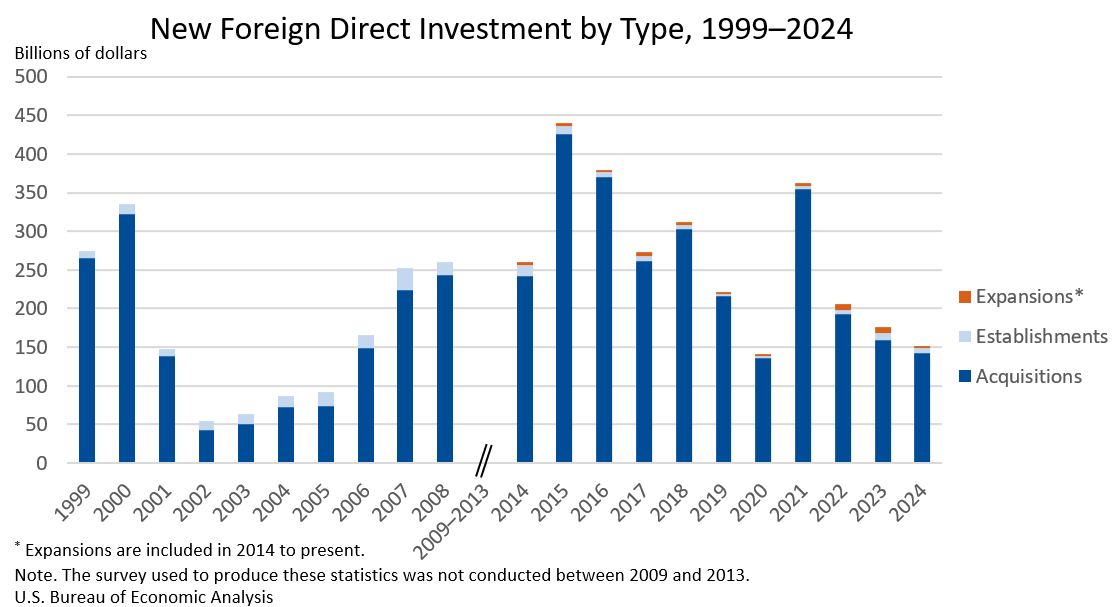
Expenditures by foreign direct investors to acquire, establish, or expand U.S. businesses totaled $151.0 billion in 2024, according to preliminary statistics released today by the U.S. Bureau of Economic Analysis. Expenditures decreased $24.9 billion, or 14.2 percent, from $176.0 billion (revised) in 2023 and were below the annual average of $277.2 billion for 2014–2023. As in previous years, acquisitions of existing U.S. businesses accounted for most of the expenditures.
Principal Federal Economic Indicators
Noteworthy
- 2025 News Release Schedule
- Innovation at BEA
- 2025 Annual Updates
- New! Services Trade Data for More Countries
- Data Tool: Trade in Value Added
- Distribution of State Personal Income
- Updated: RIMS II Regional Multipliers
- Arts and Culture
- Space Economy
- FDI Now in State BEARFACTS
- Quick Guide: Price Indexes
The Latest
Gross Domestic Product by Industry, 3rd quarter 2017
Finance and insurance; durable goods manufacturing; and information services were the leading contributors to the increase in U.S. economic growth in the third quarter of 2017. According to gross domestic product (GDP) by industry statistics released by the Bureau of Economic Analysis, 18 of 22 industry groups contributed to the overall 3.2 percent increase in real GDP in the third quarter.
November 2017 Trade Gap is $50.5 Billion
The U.S. monthly international trade deficit increased in November 2017 according to the U.S. Bureau of Economic Analysis and the U.S. Census Bureau. The deficit increased from $48.9 billion in October (revised) to $50.5 billion in November, as imports increased more than exports. The previously published October deficit was $48.7 billion. The goods deficit increased $1.7 billion in November to $70.9 billion. The services surplus increased $0…
U.S. International Trade in Goods and Services, November 2017
The U.S. monthly international trade deficit increased in November 2017 according to the U.S. Bureau of Economic Analysis and the U.S. Census Bureau. The deficit increased from $48.9 billion in October (revised) to $50.5 billion in November, as imports increased more than exports.
U.S. Net International Investment Position Third Quarter 2017
The U.S. net international investment position increased to −$7,768.7 billion (preliminary) at the end of the third quarter from −$8,004.1 billion (revised) at the end of the second quarter. The $235.4 billion increase reflected net financial transactions of –$87.4 billion and net other changes in position, such as price and exchange-rate changes, of $322.8 billion.
U.S. International Investment Position, 3rd quarter 2017
The U.S. net international investment position increased to -$7,768.7 billion (preliminary) at the end of the third quarter of 2017 from -$8,004.1 billion (revised) at the end of the second quarter, according to statistics released by the Bureau of Economic Analysis (BEA). The $235.4 billion increase reflected a $1,001.2 billion increase in U.S. assets and a $765.8 billion increase in U.S. liabilities (table 1).
BEA Focuses on Data Users With Innovations in 2017, New Projects Ahead
As we charge into 2018, it’s a fitting time to remember innovations over the past year that advanced the Bureau of Economic Analysis’ quest to produce the most accurate, timely, and objective statistics that promote better understanding of the nation’s economy.
Real Consumer Spending Rises in November
Personal income increased 0.3 percent in November after increasing 0.4 percent in October. Wages and salaries, the largest component of personal income, increased 0.4 percent in November after increasing 0.2 percent in October.
Personal Income And Outlays, November 2017
Personal income increased $54.0 billion (0.3 percent) in November according to estimates released today by the Bureau of Economic Analysis. Disposable personal income (DPI) increased $50.9 billion (0.4 percent) and personal consumption expenditures (PCE) increased $87.1 billion (0.6 percent).
GDP Up in the Third Quarter
Real gross domestic product (GDP) increased 3.2 percent in the third quarter of 2017, according to the “third” estimate released by the Bureau of Economic Analysis. The growth rate was 0.1 percentage point less than the “second” estimate released in November. In the second quarter of 2017, real GDP increased 3.1 percent.
Gross Domestic Product, 3rd quarter 2017 (third estimate); Corporate Profits, 3rd quarter 2017 (revised estimate)
Real gross domestic product (GDP) increased at an annual rate of 3.2 percent in the third quarter of 2017 (table 1), according to the "third" estimate released by the Bureau of Economic Analysis. In the second quarter, real GDP increased 3.1 percent.


