Bureau of Economic Analysis
New Foreign Direct Investment in the United States, 2024
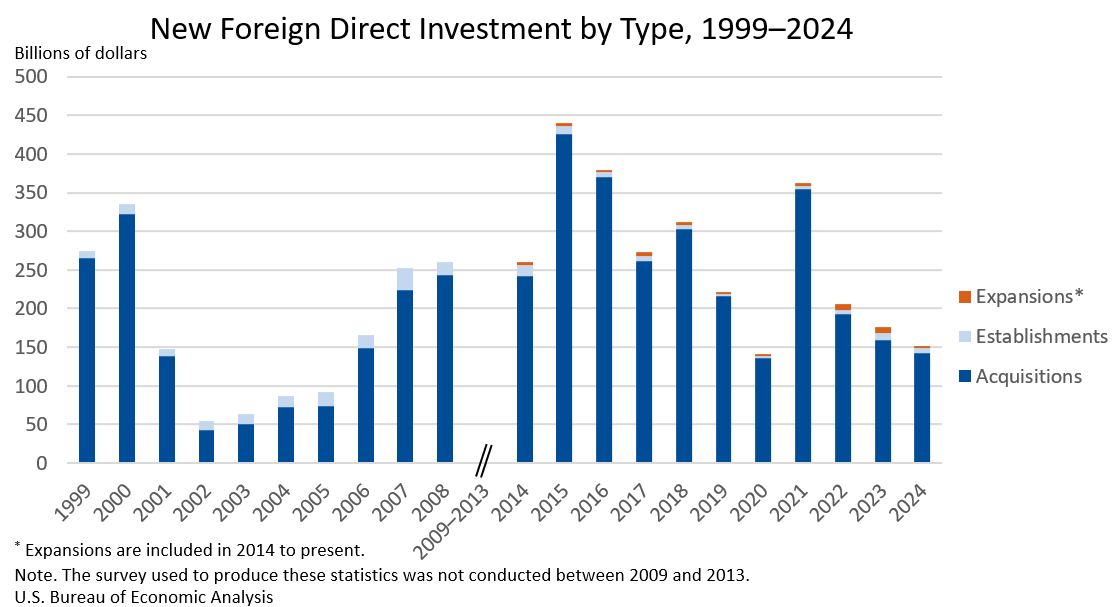
Expenditures by foreign direct investors to acquire, establish, or expand U.S. businesses totaled $151.0 billion in 2024, according to preliminary statistics released today by the U.S. Bureau of Economic Analysis. Expenditures decreased $24.9 billion, or 14.2 percent, from $176.0 billion (revised) in 2023 and were below the annual average of $277.2 billion for 2014–2023. As in previous years, acquisitions of existing U.S. businesses accounted for most of the expenditures.
Principal Federal Economic Indicators
Noteworthy
- 2025 News Release Schedule
- Innovation at BEA
- 2025 Annual Updates
- New! Services Trade Data for More Countries
- Data Tool: Trade in Value Added
- Distribution of State Personal Income
- Updated: RIMS II Regional Multipliers
- Arts and Culture
- Space Economy
- FDI Now in State BEARFACTS
- Quick Guide: Price Indexes
The Latest
U.S. International Trade in Goods and Services, May 2017
Total May exports of $192.0 billion and imports of $238.5 billion resulted in a goods and services deficit of $46.5 billion.
U.S. Net International Investment Position First Quarter 2017
The U.S. net international investment position increased to −$8,141.2 billion (preliminary) at the end of the first quarter of 2017 from −$8,318.4 billion (revised) at the end of the fourth quarter of 2016.*
Personal Savings Rate Rises in May
Personal income increased 0.4 percent in May after increasing 0.3 percent in April. Personal dividend income increased 4.8 percent in May after increasing 0.4 percent in April.
Personal Income and Outlays, May 2017
In May 2017, real disposable personal income increased 0.6 percent.
GDP Increases in First Quarter
Real gross domestic product (GDP) increased 1.4 percent in the first quarter of 2017, according to the “third” estimate released by the Bureau of Economic Analysis. The growth rate was 0.2 percentage point higher than the “second” estimate released last month. In the fourth quarter of 2016, real GDP increased 2.1 percent.
Gross Domestic Product, 1st quarter 2017 (third estimate); Corporate Profits, 1st quarter 2017 (revised estimate)
Real gross domestic product (GDP) increased at an annual rate of 1.4 percent in the first quarter of 2017 (table 1), according to the "third" estimate released by the Bureau of Economic Analysis. In the fourth quarter of 2016, real GDP increased 2.1 percent. The GDP estimate released today is based on more complete source data than were available for the "second" estimate issued last month.
U.S. Net International Investment Position First Quarter 2017
Preliminary Statistics for U.S. Net International Investment Position
Errata: The numbers in this blog no longer stand. Please refer to the updated news release and blog posted on July 5, 2017.
U.S. Net International Investment Position Year 2016
The U.S. net international investment position decreased to −$8,318.4 billion (revised) at the end of 2016 from −$7,493.5 billion (revised) at the end of 2015.
U.S. International Investment Position, 1st quarter 2017, Year 2016, and annual update
ERRATA Table 1 and relevant text in the "U.S. Net International Investment Position: First Quarter 2017, Year 2016, and Annual Update" news release and corresponding statistics in the Interactive Tables were corrected on July 5, 2017. The corrections affect statistics for portfolio investment long-term debt liabilities and related aggregate statistics for the first quarter of 2017. Related financial transactions statistics were…
State Personal Income, First Quarter 2017
State personal income growth accelerated to 1.0 percent on average in the first quarter of 2017 from 0.3 percent in the fourth quarter of 2016. Earnings and personal current transfer receipts were the leading contributors to growth for the nation and in most states.


