Bureau of Economic Analysis
Direct Investment by Country and Industry, 2024
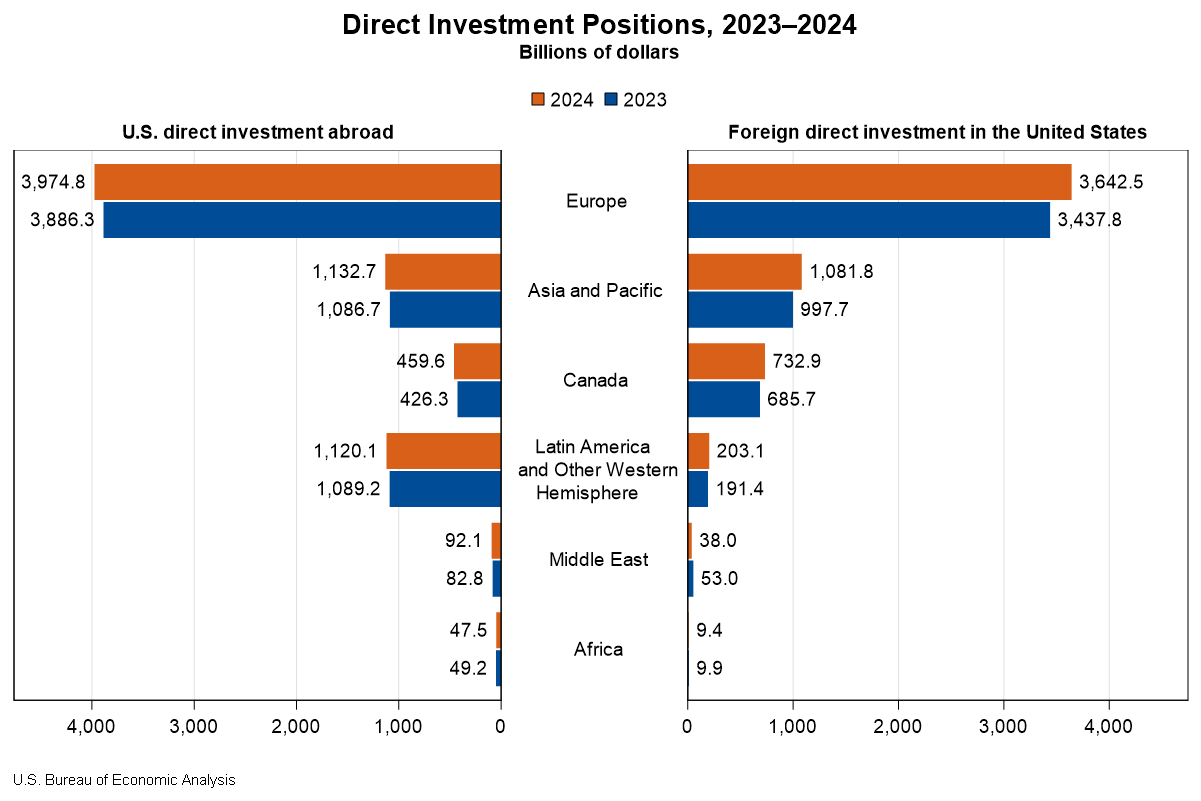
The U.S. direct investment abroad position, or cumulative level of investment, increased $206.3 billion to $6.83 trillion at the end of 2024, according to statistics released today by the U.S. Bureau of Economic Analysis. The increase was led by an $88.4 billion increase in the position in Europe, primarily in Luxembourg and Germany. By industry, manufacturing affiliates had the largest increase, led by manufacturing of computers and electronic products.
The foreign direct investment in the United States position increased $332.1 billion to $5.71 trillion at the end of 2024. The increase was led by a $204.7 billion increase in the position from Europe, which reflected a $52.9 billion increase from the United Kingdom and a $39.7 billion increase from Germany. By industry, affiliates in manufacturing increased the most.
Principal Federal Economic Indicators
Noteworthy
- 2025 News Release Schedule
- Innovation at BEA
- 2025 Annual Updates
- New! Services Trade Data for More Countries
- Data Tool: Trade in Value Added
- Distribution of State Personal Income
- Updated: RIMS II Regional Multipliers
- Arts and Culture
- Space Economy
- FDI Now in State BEARFACTS
- Quick Guide: Price Indexes
The Latest
Gross Domestic Product, 2nd quarter 2016 (third estimate); Corporate Profits, 2nd quarter 2016 (revised estimate)
Real gross domestic product increased at an annual rate of 1.4 percent in the second quarter of 2016 (table 1), according to the "third" estimate released by the Bureau of Economic Analysis. In the first quarter, real GDP increased 0.8 percent. The GDP estimate released today is based on more complete source data than were available for the "second" estimate issued last month. In the second estimate, the increase in real GDP was 1.1 percent.…
Guest blog: Announcing the Open-Source beaR Library
This is a guest blog by Justin Antonipillai – Counselor to Secretary Penny Pritzker, with the Delegated Duties of the Under Secretary for Economic Affairs
State Personal Income, Second Quarter 2016
State personal income growth accelerated to 1.0 percent on average in the second quarter of 2016 from 0.3 percent in the first quarter. Personal income grew in every state in the second-quarter with growth rates ranging from 0.4 percent in Alaska to 1.4 percent in Utah.
State Quarterly Personal Income, 2nd quarter 2016; State Annual Personal Income, 2015
State personal income growth accelerated to 1.0 percent on average in the second quarter of 2016 from 0.3 percent in the first quarter, according to estimates released today by the U.S. Bureau of Economic Analysis. Personal income grew in every state in the second-quarter with growth rates ranging from 0.4 percent in Alaska to 1.4 percent in Utah (table 1).
U.S. Net International Investment Position Second Quarter 2016
The U.S. net international investment position decreased to −$8,042.8 billion (preliminary) at the end of the second quarter of 2016 from −$7,582.0 billion (revised) at the end of the first quarter.
U.S. International Investment Position, 2nd quarter 2016
The U.S. net international investment position at the end of the second quarter of 2016 was -$8,042.8 billion (preliminary), according to statistics released today by the Bureau of Economic Analysis (BEA). The net investment position at the end of the first quarter was -$7,582.0 billion (revised).
Guam's Economy Grows in 2015
The Bureau of Economic Analysis released estimates of gross domestic product for Guam for 2015, in addition to estimates of GDP by industry and compensation by industry for 2014.
These estimates were developed under the Statistical Improvement Program funded by the Office of Insular Affairs of the U.S. Department of the Interior.
Revised estimates of Guam’s GDP for 2013 and 2014, as well as revised estimates of GDP by industry…
Gross Domestic Product by Metropolitan Area, 2015
Real gross domestic product (GDP) increased in 292 metropolitan areas in 2015, led by growth in professional and business services; wholesale and retail trade; and finance, insurance, real estate, rental and leasing, according to statistics on the geographic breakout of GDP released today by the Bureau of Economic Analysis. Collectively, real GDP for U. S. metropolitan areas increased 2.5 percent in 2015 after increasing 2.3 percent in 2014…


