Bureau of Economic Analysis
U.S. International Trade in Goods and Services, June 2025
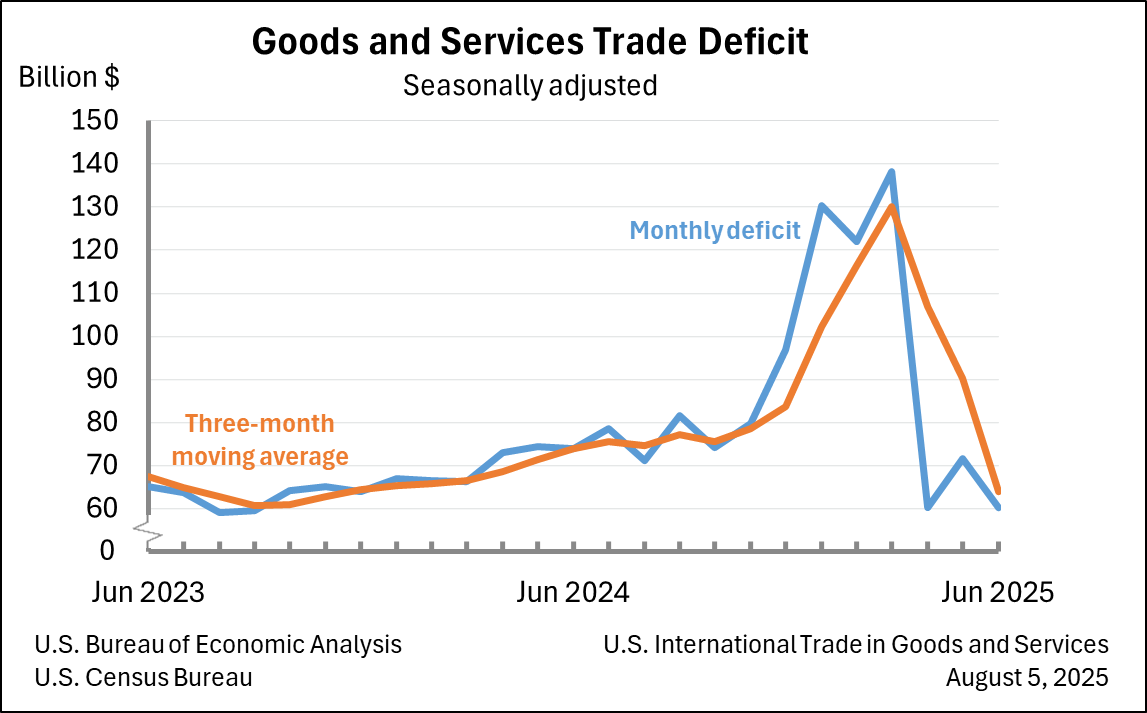
The U.S. goods and services trade deficit decreased in June 2025 according to the U.S. Bureau of Economic Analysis and the U.S. Census Bureau. The deficit decreased from $71.7 billion in May (revised) to $60.2 billion in June, as exports decreased less than imports. The goods deficit decreased $11.4 billion in June to $85.9 billion. The services surplus increased $0.1 billion in June to $25.7 billion.
Principal Federal Economic Indicators
Noteworthy
- 2025 News Release Schedule
- Innovation at BEA
- 2025 Annual Updates
- Distribution of Personal Income Nowcast
- New! Services Trade Data for More Countries
- Data Tool: Trade in Value Added
- Updated: RIMS II Regional Multipliers
- Arts and Culture
- Space Economy
- FDI Now in State BEARFACTS
- Quick Guide: Price Indexes
The Latest
Spending on Durable Goods Falls in August
Personal income increased 0.2 percent in August after increasing 0.4 percent in July. Wages and salaries, the largest component of personal income, increased 0.1 percent in August after increasing 0.5 percent in July.
Personal Income and Outlays, August 2016
Personal income increased $39.3 billion (0.2 percent) in August according to estimates released today by the Bureau of Economic Analysis. Disposable personal income (DPI) increased $31.9 billion (0.2 percent) and personal consumption expenditures (PCE) increased $6.2 billion (less than 0.1 percent). Real DPI increased 0.1 percent in August and Real PCE decreased 0.1 percent. The PCE price index increased 0.1 percent.
GDP Increases in Second Quarter
Real gross domestic product (GDP) increased 1.4 percent in the second quarter of 2016, according to the “third” estimate released by the Bureau of Economic Analysis. The growth rate was 0.3 percentage point higher than the “second” estimate released in August. In the first quarter, real GDP rose 0.8 percent.
Gross Domestic Product, 2nd quarter 2016 (third estimate); Corporate Profits, 2nd quarter 2016 (revised estimate)
Real gross domestic product increased at an annual rate of 1.4 percent in the second quarter of 2016 (table 1), according to the "third" estimate released by the Bureau of Economic Analysis. In the first quarter, real GDP increased 0.8 percent. The GDP estimate released today is based on more complete source data than were available for the "second" estimate issued last month. In the second estimate, the increase in real GDP was 1.1 percent.…
Guest blog: Announcing the Open-Source beaR Library
This is a guest blog by Justin Antonipillai – Counselor to Secretary Penny Pritzker, with the Delegated Duties of the Under Secretary for Economic Affairs
State Personal Income, Second Quarter 2016
State personal income growth accelerated to 1.0 percent on average in the second quarter of 2016 from 0.3 percent in the first quarter. Personal income grew in every state in the second-quarter with growth rates ranging from 0.4 percent in Alaska to 1.4 percent in Utah.
State Quarterly Personal Income, 2nd quarter 2016; State Annual Personal Income, 2015
State personal income growth accelerated to 1.0 percent on average in the second quarter of 2016 from 0.3 percent in the first quarter, according to estimates released today by the U.S. Bureau of Economic Analysis. Personal income grew in every state in the second-quarter with growth rates ranging from 0.4 percent in Alaska to 1.4 percent in Utah (table 1).
U.S. Net International Investment Position Second Quarter 2016
The U.S. net international investment position decreased to −$8,042.8 billion (preliminary) at the end of the second quarter of 2016 from −$7,582.0 billion (revised) at the end of the first quarter.
U.S. International Investment Position, 2nd quarter 2016
The U.S. net international investment position at the end of the second quarter of 2016 was -$8,042.8 billion (preliminary), according to statistics released today by the Bureau of Economic Analysis (BEA). The net investment position at the end of the first quarter was -$7,582.0 billion (revised).


