Bureau of Economic Analysis
New Foreign Direct Investment in the United States, 2024
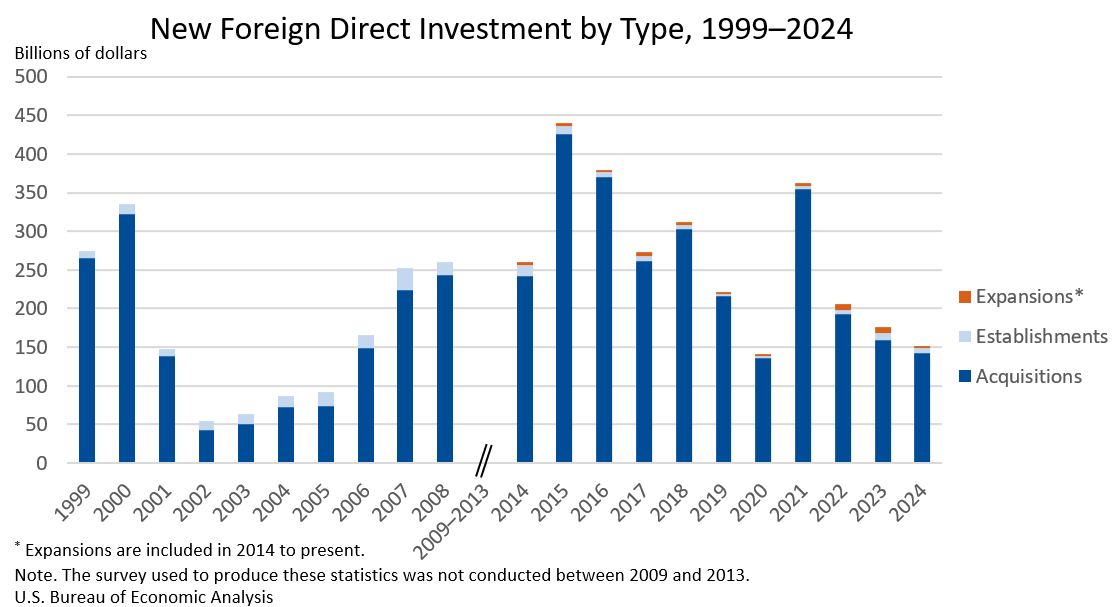
Expenditures by foreign direct investors to acquire, establish, or expand U.S. businesses totaled $151.0 billion in 2024, according to preliminary statistics released today by the U.S. Bureau of Economic Analysis. Expenditures decreased $24.9 billion, or 14.2 percent, from $176.0 billion (revised) in 2023 and were below the annual average of $277.2 billion for 2014–2023. As in previous years, acquisitions of existing U.S. businesses accounted for most of the expenditures.
Principal Federal Economic Indicators
Noteworthy
- 2025 News Release Schedule
- Innovation at BEA
- 2025 Annual Updates
- New! Services Trade Data for More Countries
- Data Tool: Trade in Value Added
- Distribution of State Personal Income
- Updated: RIMS II Regional Multipliers
- Arts and Culture
- Space Economy
- FDI Now in State BEARFACTS
- Quick Guide: Price Indexes
The Latest
Gross Domestic Product, Fourth Quarter and Year 2023 (Third Estimate), GDP by Industry, and Corporate Profits
Real gross domestic product (GDP) increased at an annual rate of 3.4 percent in the fourth quarter of 2023, according to the “third” estimate. In the third quarter, real GDP increased 4.9 percent. The increase in the fourth quarter primarily reflected increases in consumer spending, state and local government spending, exports, nonresidential fixed investment, federal government spending, and residential fixed investment that were partly offset…
U.S. International Investment Position, Year 2023
The U.S. net international investment position, the difference between U.S. residents’ foreign financial assets and liabilities, was –$19.77 trillion at the end of 2023, according to statistics released today by the U.S. Bureau of Economic Analysis. Assets totaled $34.54 trillion, and liabilities were $54.31 trillion. At the end of 2022, the net investment position was –$16.17 trillion.
U.S. International Investment Position, 4th Quarter 2023
The U.S. net international investment position, the difference between U.S. residents’ foreign financial assets and liabilities, was –$19.77 trillion at the end of the fourth quarter of 2023, according to statistics released today by the U.S. Bureau of Economic Analysis. Assets totaled $34.54 trillion, and liabilities were $54.31 trillion. At the end of the third quarter, the net investment position was –$18.11 trillion.
U.S. International Investment Position, 4th Quarter and Year 2023
The U.S. net international investment position, the difference between U.S. residents’ foreign financial assets and liabilities, was -$19.77 trillion at the end of the fourth quarter of 2023, according to statistics released today by the U.S. Bureau of Economic Analysis (BEA). Assets totaled $34.54 trillion, and liabilities were $54.31 trillion. At the end of the third quarter, the net investment position was -$18.11 trillion (revised).
Arts and Culture Economy Grows 4.8 Percent in 2022
Arts and cultural economic activity, adjusted for inflation, increased 4.8 percent in 2022 after increasing 10.8 percent in 2021, according to statistics released today by the Bureau of Economic Analysis. By comparison, the broader economy, as measured by real gross domestic product, increased 1.9 percent in 2022 after increasing 5.8 percent in 2021.
Arts and cultural economic activity accounted for 4.3 percent of GDP, or $1.10…
Arts and Cultural Production Satellite Account, U.S. and States, 2022
The Arts and Cultural Production Satellite Account released today by the U.S. Bureau of Economic Analysis (BEA) shows that arts and cultural economic activity, adjusted for inflation, increased 4.8 percent in 2022 after increasing 10.8 percent in 2021. By comparison, the broader economy, as measured by real gross domestic product (GDP), increased 1.9 percent in 2022 after increasing 5.8 percent in 2021. Arts and cultural economic activity…
U.S. Current-Account Deficit Narrows in 2023
The U.S. current-account deficit, which reflects the combined balances on trade in goods and services and income flows between U.S. residents and residents of other countries, narrowed by $152.8 billion, or 15.7 percent, to $818.8 billion in 2023. The narrowing mostly reflected a reduced deficit on goods. The 2023 deficit was 3.0 percent of current-dollar gross domestic product, down from 3.8 percent in 2022.
U.S. Current-Account Deficit Narrows in 4th Quarter 2023
The U.S. current-account deficit, which reflects the combined balances on trade in goods and services and income flows between U.S. residents and residents of other countries, narrowed by $1.6 billion, or 0.8 percent, to $194.8 billion in the fourth quarter of 2023. The narrowing primarily reflected a reduced deficit on secondary income that was mostly offset by an expanded deficit on goods. The fourth-quarter deficit was 2.8 percent of…
U.S. International Transactions, 4th Quarter and Year 2023
The U.S. current-account deficit narrowed by $1.6 billion, or 0.8 percent, to $194.8 billion in the fourth quarter of 2023, according to statistics released today by the U.S. Bureau of Economic Analysis. The revised third-quarter deficit was $196.4 billion. The fourth-quarter deficit was 2.8 percent of current-dollar gross domestic product, down less than 0.1 percent from the third quarter.
Beer and the Balance of Payments
A blog post from BEA Director Vipin Arora
Trade—what Adam Smith described as our intrinsic "propensity to truck, barter, and exchange one thing for another"—has helped to make today's world. It is hard to say how long trade has been with us, but certainly since the beginning of recorded history, and likely much longer. One of my favorite examples is beer, which was a very popular beverage in ancient Mesopotamia. As far back as…


