
Bureau of Economic Analysis
Personal Income and Outlays, June 2025
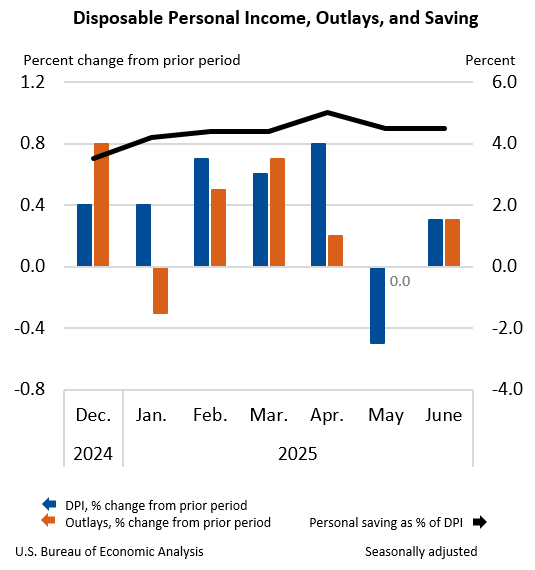
Personal income increased $71.4 billion (0.3 percent at a monthly rate) in June, according to estimates released today by the U.S. Bureau of Economic Analysis. Disposable personal income (DPI)—personal income less personal current taxes—increased $61.0 billion (0.3 percent) and personal consumption expenditures (PCE) increased $69.9 billion (0.3 percent). Personal outlays—the sum of PCE, personal interest payments, and personal current transfer payments—increased $69.5 billion in June. Personal saving was $1.01 trillion in June and the personal saving rate—personal saving as a percentage of disposable personal income—was 4.5 percent.
Principal Federal Economic Indicators
Noteworthy
- 2025 News Release Schedule
- Innovation at BEA
- 2025 Annual Updates
- New! Services Trade Data for More Countries
- Data Tool: Trade in Value Added
- Distribution of State Personal Income
- Updated: RIMS II Regional Multipliers
- Arts and Culture
- Space Economy
- FDI Now in State BEARFACTS
- Quick Guide: Price Indexes


The Latest
Personal Income and Outlays, June 2015; Includes historical revisions
Personal income increased $68.1 billion, or 0.4 percent, and disposable personal income (DPI) increased $60.6 billion, or 0.5 percent, in June, according to the Bureau of Economic Analysis. Personal consumption expenditures (PCE) increased $25.9 billion, or 0.2 percent.
Detailed Direct Investment Data for 2014 Now Available
Detailed statistics on U.S. direct investment abroad – or “outward direct investment”– and on foreign direct investment in the United States – or “inward direct investment” are now available on BEA’s website.
GDP Increases in Second Quarter
Real gross domestic product (GDP) increased 2.3 percent in the second quarter of 2015, according to the “advance” estimate released by the Bureau of Economic Analysis. In the first quarter, real GDP increased 0.6 percent (revised).
GDP highlights The second-quarter increase in real GDP mainly reflected an increase in consumer spending. Spending on both durable goods, notably motor vehicles and parts, and nondurable goods increased.…
Gross Domestic Product, 2nd quarter 2015 (advance estimate); Includes historical revisions
Real gross domestic product -- the value of the production of goods and services in the United States, adjusted for price changes -- increased at an annual rate of 2.3 percent in the second quarter of 2015, according to the "advance" estimate released by the Bureau of Economic Analysis.
Industry in Focus: Transportation and Warehousing
Transportation and warehousing is an industry that is important to everyone, whether you’re an individual flying home to visit family or a business expecting a shipment of raw materials. In the first quarter of 2015, transportation and warehousing subtracted 0.56 percentage point from real Gross Domestic Product, and was the largest contributor to the 0.2 percent decrease in GDP.
Nondurable Goods Manufacturing Led the Downturn in First Quarter Gross Domestic Product by Industry
A deceleration in nondurable goods manufacturing and downturns in both professional, scientific, and technical services and wholesale trade were the leading contributors to the downturn in U.S. economic growth in the first quarter of 2015. Overall, 15 of 22 industry groups contributed to the downturn in the first quarter.
Gross Domestic Product by Industry, 1st quarter, 2015
A deceleration in nondurable goods manufacturing and downturns in both professional, scientific, and technical services and wholesale trade were the leading contributors to the downturn in U.S. economic growth in the first quarter of 2015, according to statistics on the breakout of GDP by industry released today by the Bureau of Economic Analysis (BEA). Overall, 15 of 22 industry groups contributed to the downturn in the first quarter.
Why Does BEA Revise GDP Estimates?
Each summer, the Bureau of Economic Analysis updates its Gross Domestic Product estimates to incorporate sources of data previously unavailable and make improvements in methodology –– all with the goal of providing the most accurate measure of the U.S. economy’s performance.
Coming Soon: Webinar for BE–10 Survey Respondents—What Private Funds Need to Know
Take part in a webinar, co-hosted by the U.S. Bureau of Economic Analysis and the Association for Corporate Growth, on Thursday, July 16, at 2 p.m., where you’ll receive an overview of the BE–10 Benchmark Survey of U.S. Direct Investment Abroad and learn more about how it applies to private funds.
BEA's API Expands Access to All Regional Data
Developers, your requests have been heard. All regional data from the Bureau of Economic Analysis are now accessible through our application programming interface, or API. This includes industry detail for certain estimates, back-year estimates under the SIC industry structure and every statistic currently available in our interactive data tables.