
Bureau of Economic Analysis
Personal Income and Outlays, June 2025
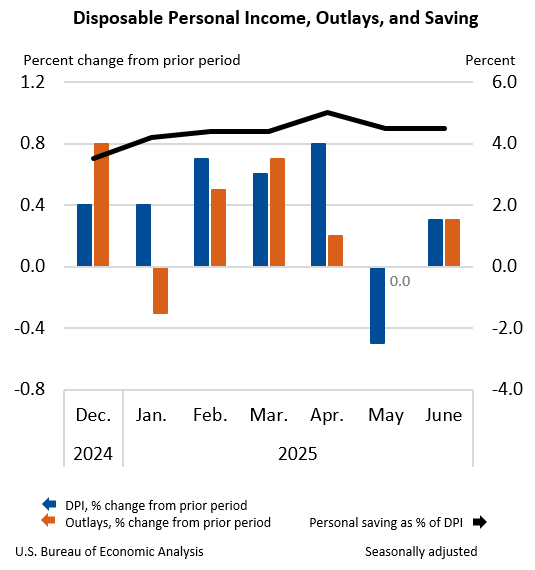
Personal income increased $71.4 billion (0.3 percent at a monthly rate) in June, according to estimates released today by the U.S. Bureau of Economic Analysis. Disposable personal income (DPI)—personal income less personal current taxes—increased $61.0 billion (0.3 percent) and personal consumption expenditures (PCE) increased $69.9 billion (0.3 percent). Personal outlays—the sum of PCE, personal interest payments, and personal current transfer payments—increased $69.5 billion in June. Personal saving was $1.01 trillion in June and the personal saving rate—personal saving as a percentage of disposable personal income—was 4.5 percent.
Principal Federal Economic Indicators
Noteworthy
- 2025 News Release Schedule
- Innovation at BEA
- 2025 Annual Updates
- New! Services Trade Data for More Countries
- Data Tool: Trade in Value Added
- Distribution of State Personal Income
- Updated: RIMS II Regional Multipliers
- Arts and Culture
- Space Economy
- FDI Now in State BEARFACTS
- Quick Guide: Price Indexes


The Latest
May 2015 Trade Gap is $41.9 Billion
The U.S. monthly international trade deficit increased in May 2015 according to the U.S. Bureau of Economic Analysis and the U.S. Census Bureau. The deficit increased from $40.7 billion in April (revised) to $41.9 billion in May, as exports decreased more than imports. The previously published April deficit was $40.9 billion. The goods deficit increased $1.2 billion from April to $61.5 billion in May. The services surplus increased less than…
U.S. International Trade in Goods and Services, May 2015
U.S. Census Bureau U.S. Bureau of Economic Analysis NEWS U.S. Department of Commerce * Washington, DC 20230 U.S. INTERNATIONAL TRADE IN GOODS AND SERVICES MAY 2015 The U.S. Census Bureau and the U.S. Bureau of Economic Analysis, through the Department of Commerce, announced today…
Real Personal Income for States, 2013
Real personal income across all regions rose by an average of 0.8 percent in 2013. This growth rate reflects the year-over-year change in nominal personal income across all regions adjusted by the change in the national personal consumption expenditures (PCE) price index. On a nominal basis, personal income across all regions grew an average of 2.0 percent in 2013. In 2013, the U.S. PCE price index grew 1.2 percent.
Real Personal Income for Metropolitan Areas, 2013
Real personal income across all regions rose by an average of 0.8 percent in 2013. This growth rate reflects the year-over-year change in nominal personal income across all regions adjusted by the change in the national personal consumption expenditures (PCE) price index. On a nominal basis, personal income across all regions grew an average of 2.0 percent in 2013. In 2013, the U.S. PCE price index grew 1.2 percent.
Real Personal Income for States and Metropolitan Areas, 2013
Real personal income across all regions rose by an average of 0.8 percent in 2013. This growth rate reflects the year-over-year change in nominal personal income across all regions adjusted by the change in the national personal consumption expenditures (PCE) price index. On a nominal basis, personal income across all regions grew an average of 2.0 percent in 2013. In 2013, the U.S. PCE price index grew 1.2 percent.
Value of U.S. Assets Increased More than U.S. Liabilities in First Quarter 2015
The U.S. net international investment position was -$6,794.0 billion (preliminary) at the end of the first quarter of 2015 as the value of U.S. liabilities exceeded the value of U.S .assets. At the end of the fourth quarter of 2014, the net investment position -$7,019.7 billion (revised).
U.S. International Investment Position, 1st quarter 2015, Year 2014, and Annual Revisions
First Quarter of 2015
The U.S. net international investment position at the end of the first quarter of 2015 was -$6,794.0 billion (preliminary) as the value of U.S. liabilities exceeded the value of U.S. assets (chart 1, table 1). At the end of the fourth quarter of 2014, the net investment position was -$7,019.7 billion (revised).
BEA to Release 2013 Statistics on Real Personal Income for States and Metro Areas July 1
The Bureau of Economic Analysis will publish real personal income statistics for the 50 states, the District of Columbia, and all metropolitan areas on Wednesday, July 1 at 8:30 a.m. eastern time.
The report provides annual statistics for 2013. These statistics use regional price parities in combination with the personal consumption expenditure price index to adjust BEA’s personal income data for differences in price levels across the…
Real Consumer Spending Rises in May
Personal income increased 0.5 percent in May, the same increase as in April. Wages and salaries, the largest component of personal income, rose 0.5 percent in May after rising 0.3 percent in April.
Current-dollar disposable personal income (DPI), after-tax income, increased 0.5 percent in May after rising 0.4 percent in April.
Real DPI, income adjusted for taxes and inflation, increased 0.2 percent in May…
Personal Income and Outlays, May 2015
Personal income increased $79.0 billion, or 0.5 percent, and disposable personal income (DPI) increased $65.5 billion, or 0.5 percent, in May, according to the Bureau of Economic Analysis. Personal consumption expenditures (PCE) increased $105.9 billion, or 0.9 percent. In April, personal income increased $69.6 billion, or 0.5 percent, DPI increased $57.0 billion, or 0.4 percent, and PCE increased $8.5 billion, or 0.1 percent, based on…