Bureau of Economic Analysis
New Foreign Direct Investment in the United States, 2024
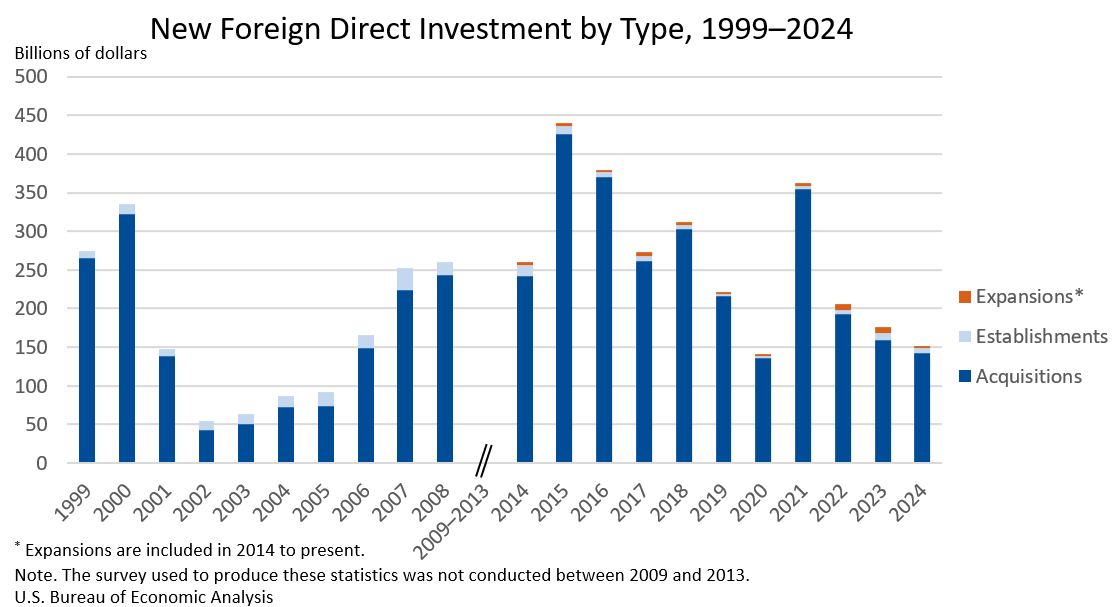
Expenditures by foreign direct investors to acquire, establish, or expand U.S. businesses totaled $151.0 billion in 2024, according to preliminary statistics released today by the U.S. Bureau of Economic Analysis. Expenditures decreased $24.9 billion, or 14.2 percent, from $176.0 billion (revised) in 2023 and were below the annual average of $277.2 billion for 2014–2023. As in previous years, acquisitions of existing U.S. businesses accounted for most of the expenditures.
Principal Federal Economic Indicators
Noteworthy
- 2025 News Release Schedule
- Innovation at BEA
- 2025 Annual Updates
- New! Services Trade Data for More Countries
- Data Tool: Trade in Value Added
- Distribution of State Personal Income
- Updated: RIMS II Regional Multipliers
- Arts and Culture
- Space Economy
- FDI Now in State BEARFACTS
- Quick Guide: Price Indexes
The Latest
Travel and Tourism Satellite Accounts, 1st quarter 2015
Real spending (output) on travel and tourism decelerated in the first quarter of 2015, increasing at an annual rate of 2.0 percent after increasing 4.9 percent (revised) in the fourth quarter of 2014. By comparison, real gross domestic product (GDP) turned down, decreasing 0.7 percent (second estimate) in the first quarter after increasing 2.2 percent.
State Personal Income: First Quarter 2015
State personal income grew 0.9 percent on average in the first quarter of 2015, after growing 1.1 percent in the fourth quarter of 2014. Personal income grew in 46 states and growth accelerated in 15 of those states. The fastest growth, 1.3 percent, was in Florida. Personal income fell in four states, with the largest decline, 1.2 percent, in Iowa. The national price index for personal consumption expenditures, fell 0.5 percent in the first…
First Quarter 2015 Travel and Tourism Spending Data to Be Released June 23
Statistics on what Americans and foreigners spent on travel and tourism in the United States in the first quarter of 2015 will be released Tuesday, June 23 by the Bureau of Economic Analysis (BEA).
The statistics, part of BEA’s Travel and Tourism Satellite Accounts, provide a breakdown of the various components of travel and tourism spending, including lodging, meals, air travel, and shopping. The statistics will also provide data on…
State Quarterly Personal Income, 1st quarter 2014 - 1st quarter 2015
State personal income grew 0.9 percent on average in the first quarter of 2015, after growing 1.1 percent in the fourth quarter of 2014, according to estimates released today by the U.S. Bureau of Economic Analysis. Personal income grew in 46 states and growth accelerated in 15 of those states. The fastest growth, 1.3 percent, was in Florida. Personal income fell in four states, with the largest decline, 1.2 percent, in Iowa.
Why Does BEA Revise GDP Estimates?
Each summer, the Bureau of Economic Analysis updates its Gross Domestic Product estimates to incorporate sources of data previously unavailable and make improvements in methodology –– all with the goal of providing the most accurate measure of the U.S. economy’s performance.
First Quarter State Personal Income Statistics to be Released June 22
Preliminary statistics on people’s incomes by state in the first quarter of 2015 will be released Monday, June 22 by the U.S. Bureau of Economic Analysis (BEA).
These state personal income statistics will provide BEA’s first look at state economies for the January-March quarter of 2015 and serve as a basis for government and business decision making. For example:
U.S. Current-Account Deficit Increases in First Quarter 2015
The U.S. current-account deficit – a net measure of transactions between the United States and the rest of the world in goods, services, primary income (investment income and compensation), and secondary income (current transfers) – increased to $113.3 billion (preliminary) in the first quarter of 2015 from $103.1 billion (revised) in the fourth quarter of 2014. As a percentage of U.S. GDP, the deficit increased to 2.6 percent from 2.3…
U.S. International Transactions, 1st quarter 2015 and Annual Revisions
NOTE: See the navigation bar at the right side of the news release text forimportant note about the comprehensive restructuring of the International Economic Accounts. Also see--> links to data tables, contact personnel and their telephone numbers, and supplementary materials. -->
Preview of the 2015 Annual Revision of the National Income and Product Accounts
On July 30, the Bureau of Economic Analysis will release its annual update of the national income and product accounts (NIPAs) in conjunction with the advance estimate for the second quarter of 2015. As is usual for annual NIPA revisions, the revised estimates will incorporate newly available source data that are more complete, more detailed, and otherwise more reliable than those that were previously incorporated.
This year’s annual…
Broad Growth Across States in 2014
Real GDP increased in 48 states and the District of Columbia in 2014. Leading industry contributors were professional, scientific, and technical services; nondurable goods manufacturing; and real estate and rental and leasing. Professional, scientific, and technical services was the largest contributor to U.S. real GDP by state growth in 2014. This industry contributed to real GDP growth in 46 states and the District of Columbia.


