Bureau of Economic Analysis
Activities of U.S. Multinational Enterprises, 2023
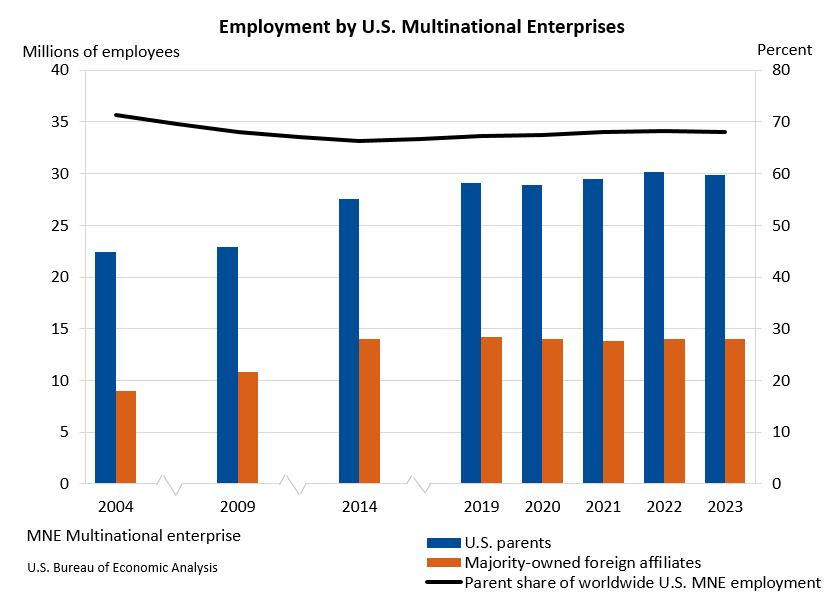
Worldwide employment by U.S. multinational enterprises decreased 0.4 percent to 43.9 million workers in 2023 (preliminary) from 44.1 million workers in 2022 (revised), according to statistics released today by the U.S. Bureau of Economic Analysis on the operations and finances of U.S. parent companies and their foreign affiliates.
Principal Federal Economic Indicators
Noteworthy
- 2025 News Release Schedule
- Innovation at BEA
- 2025 Annual Updates
- Distribution of Personal Income Nowcast
- New! Services Trade Data for More Countries
- Data Tool: Trade in Value Added
- Updated: RIMS II Regional Multipliers
- Arts and Culture
- Space Economy
- FDI Now in State BEARFACTS
- Quick Guide: Price Indexes
The Latest
U.S. International Trade in Goods and Services, 2015 Annual Revision
U.S. Census Bureau U.S. Bureau of Economic Analysis NEWS U.S. Department of Commerce * Washington, D.C. 20230
U.S. International Trade in Goods and Services
Annual Revision for 2014
Disposable Income Rises in April
Personal income increased 0.4 percent in April after increasing less than 0.1 percent in March. Wages and salaries, the largest component of personal income, rose 0.2 percent in April after rising 0.1 percent in March.
Current-dollar disposable personal income (DPI), after-tax income, increased 0.4 percent in April after rising less than 0.1 percent in March, reflecting increases in income receipts on assets and wages…
Personal Income and Outlays, April 2015
Personal income increased $59.4 billion, or 0.4 percent, and disposable personal income (DPI) increased $48.8 billion, or 0.4 percent, in April, according to the Bureau of Economic Analysis. Personal consumption expenditures (PCE) decreased $2.6 billion, or less than 0.1 percent.
First-Quarter GDP Revised Down: "Second" Estimate of GDP
Real gross domestic product (GDP) decreased 0.7 percent in the first quarter of 2015, according to the “second” estimate released by the Bureau of Economic Analysis. The growth rate was revised down 0.9 percentage point from the “advance” estimate released in April. In the fourth quarter of 2014, real GDP increased 2.2 percent.
GDP highlights The first-quarter decline in real GDP reflected declines in the following:
Gross Domestic Product, 1st quarter 2015 (second estimate); Corporate Profits, 1st quarter 2015 (preliminary estimate)
Real gross domestic product -- the value of the production of goods and services in the United States, adjusted for price changes -- decreased at an annual rate of 0.7 percent in the first quarter of 2015, according to the "second" estimate released by the Bureau of Economic Analysis. In the fourth quarter, real GDP increased 2.2 percent. The GDP estimate released today is based on more complete source data than were available for…
BEA's New Data Tool Provides Fast Access to Trade and Investment Stats for Countries
A new data tool–International Trade and Investment Country Facts Application–on the Bureau of Economic Analysis website gives users a snapshot of statistics on trade and investment between the United States and another country by simply clicking on a world map.
These fast facts at your fingertips can include:
BEA Works to Mitigate Potential Sources of Residual Seasonality in GDP
The Bureau of Economic Analysis (BEA) is working on a multi-pronged action plan to improve its estimates of gross domestic product (GDP) by identifying and mitigating potential sources of “residual” seasonality. That’s when seasonal patterns remain in data even after they are adjusted for seasonal variations.
Accounting for Seasonality in GDP
BEA’s estimates of GDP are seasonally adjusted to remove fluctuations that normally occur at about the same time and the same magnitude each year. Seasonal adjustment ensures that the remaining movements in GDP, or any other economic series, better reflect true patterns in economic activity. Examples of factors that may influence seasonal patterns include weather, holidays, and production schedules. (See “Why and how are…
New FAQs Aim to Help Private Funds Determine When They Have to File a Survey to BEA for U.S. Direct Investment Abroad
Gaining a detailed picture of the role the United States plays in the global market place is made easier by the wealth of international investment statistics produced by the Bureau of Economic Analysis. So it’s critically important that we get the most accurate information possible from businesses, private funds, and others who fill out our BEA surveys.
Coming in July: BEA to Launch New Tools for Analyzing Economic Growth
The Bureau of Economic Analysis plans to launch two new statistics that will serve as tools to help businesses, economists, policymakers and the American public better analyze the performance of the U.S. economy. These tools will be available on July 30 and emerge from an annual BEA process where improvements and revisions to GDP data are implemented. BEA created these two new tools in response to demand from our customers.
Average of…


