
Bureau of Economic Analysis
Personal Income and Outlays, June 2025
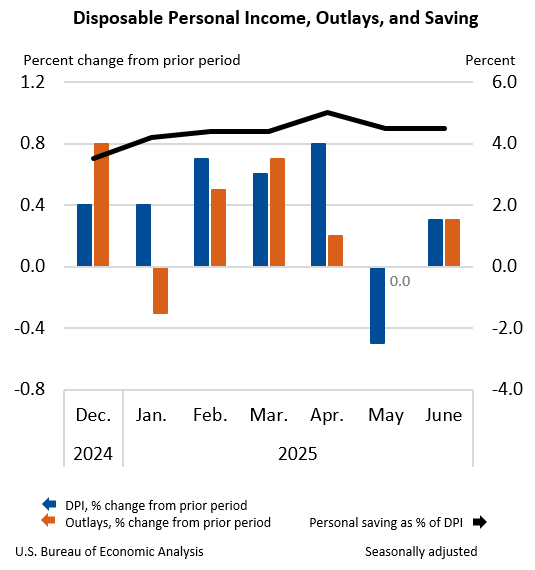
Personal income increased $71.4 billion (0.3 percent at a monthly rate) in June, according to estimates released today by the U.S. Bureau of Economic Analysis. Disposable personal income (DPI)—personal income less personal current taxes—increased $61.0 billion (0.3 percent) and personal consumption expenditures (PCE) increased $69.9 billion (0.3 percent). Personal outlays—the sum of PCE, personal interest payments, and personal current transfer payments—increased $69.5 billion in June. Personal saving was $1.01 trillion in June and the personal saving rate—personal saving as a percentage of disposable personal income—was 4.5 percent.
Principal Federal Economic Indicators
Noteworthy
- 2025 News Release Schedule
- Innovation at BEA
- 2025 Annual Updates
- New! Services Trade Data for More Countries
- Data Tool: Trade in Value Added
- Distribution of State Personal Income
- Updated: RIMS II Regional Multipliers
- Arts and Culture
- Space Economy
- FDI Now in State BEARFACTS
- Quick Guide: Price Indexes


The Latest
Gross Domestic Product, 4th quarter and annual 2014 (third estimate); Corporate Profits, 4th quarter and annual 2014
Real gross domestic product -- the value of the production of goods and services in the United States, adjusted for price changes -- increased at an annual rate of 2.2 percent in the fourth quarter of 2014, according to the "third" estimate released by the Bureau of Economic Analysis. In the third quarter, real GDP increased 5.0 percent. The GDP estimate released today is based on more complete source data than were available for…
State Personal Income: Fourth Quarter 2014
State personal income grew 1.0 percent on average in the fourth quarter of 2014, the same average growth rate as in the third quarter. The acceleration in personal income growth in Florida, Texas, and 30 other states was offset by a slowdown in 15 states, including California and New York. Growth rates ranged from 0.6 percent in Louisiana to 1.5 percent in Texas. The national price index for personal consumption expenditures fell 0.1 percent…
State Personal Income 2014
Average state personal income growth accelerated to 3.9 percent in 2014 from 2.0 percent in 2013. Growth of state personal income – the sum of net earnings by place of residence, property income, and personal current transfer receipts – ranged from 0.5 percent Nebraska to 5.7 percent in Alaska and Oregon, with 45 states growing faster in 2014 than in 2013. Inflation, as measured by the national price index for personal consumption…
State Quarterly Personal Income, 1st quarter 2014 - 4th quarter 2014; State Annual Personal Income, 2014 (preliminary estimates)
Average state personal income growth accelerated to 3.9 percent in 2014 from 2.0 percent in 2013, according to estimates released today by the U.S. Bureau of Economic Analysis. Growth of state personal income–the sum of net earnings by place of residence, property income, and personal current transfer receipts–ranged from 0.5 percent in Nebraska to 5.7 percent in Alaska and Oregon, with 45 states growing faster in 2014 than in 2013.
U.S. Current-Account Deficit Increases in Fourth Quarter 2014
The U.S. current-account deficit—a net measure of transactions between the United States and the rest of the world in goods, services, primary income (investment income and compensation), and secondary income (current transfers)—increased to $113.5 billion (preliminary) in the fourth quarter of 2014 from $98.9 billion (revised) in the third quarter of 2014. As a percentage of U.S. GDP, the deficit increased to 2.6 percent from 2.2 percent.…
U.S. International Transactions, 4th quarter and Year 2014
NOTE: See the navigation bar at the right side of the news release text forimportant note about the comprehensive restructuring of the International Economic Accounts. Also see--> links to data tables, contact personnel and their telephone numbers, and supplementary materials. -->
William Zeile: (202) 606-9893 (Data) Christopher Gohrband: (202) 606-9564 (Revisions)
Travel and Tourism Spending Accelerated in the Fourth Quarter of 2014
Real spending on travel and tourism accelerated in the fourth quarter of 2014, increasing at an annual rate of 4.5 percent after increasing 3.4 percent (revised) in the third quarter. By comparison, real gross domestic product (GDP) decelerated, increasing 2.2 percent (second estimate) in the fourth quarter after increasing 5.0 percent. For the year, real spending on travel and tourism increased 2.5 percent in 2014 after increasing 3.6…
Travel and Tourism Satellite Accounts, 4th quarter 2014
Real spending on travel and tourism accelerated in the fourth quarter of 2014, increasing at an annual rate of 4.5 percent after increasing 3.4 percent (revised) in the third quarter. By comparison, real gross domestic product (GDP) decelerated, increasing 2.2 percent (second estimate) in the fourth quarter after increasing 5.0 percent. For the year, real spending on travel and tourism increased 2.5 percent in 2014 after increasing 3.6…
BEA's Statistics on How Industries Perform Each Quarter Provide Insight into U.S.' Economic Recovery
Thanks to a new set of BEA data, you can now find out how the economic recovery that began in the summer of 2009 is affecting America’s industries each quarter.
Last spring, BEA for the first time began producing on a regular basisquarterly statistics that provide information on the amount of economic activity generated by individual industries, making it easy to spot when and how fast these industries began to recover.
January 2015 Trade Gap is $41.8 Billion
The U.S. monthly international trade deficit decreased in January 2015 according to the U.S. Bureau of Economic Analysis and the U.S. Census Bureau. The deficit decreased from $45.6 billion in December (revised) to $41.8 billion in January, as imports decreased more than exports. The previously published December deficit was $46.6 billion. The goods deficit decreased $3.4 billion from December to $61.6 billion in January. The services surplus…