Bureau of Economic Analysis
U.S. International Trade in Goods and Services, June 2025
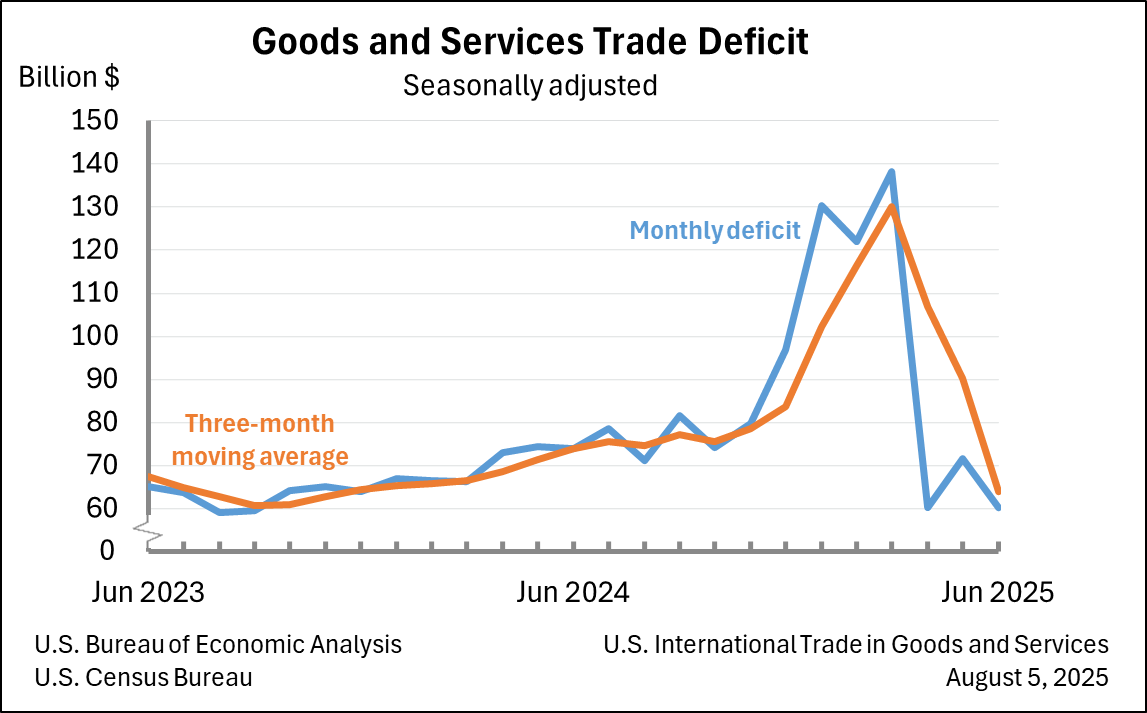
The U.S. goods and services trade deficit decreased in June 2025 according to the U.S. Bureau of Economic Analysis and the U.S. Census Bureau. The deficit decreased from $71.7 billion in May (revised) to $60.2 billion in June, as exports decreased less than imports. The goods deficit decreased $11.4 billion in June to $85.9 billion. The services surplus increased $0.1 billion in June to $25.7 billion.
Principal Federal Economic Indicators
Noteworthy
- 2025 News Release Schedule
- Innovation at BEA
- 2025 Annual Updates
- New! Services Trade Data for More Countries
- Data Tool: Trade in Value Added
- Distribution of State Personal Income
- Updated: RIMS II Regional Multipliers
- Arts and Culture
- Space Economy
- FDI Now in State BEARFACTS
- Quick Guide: Price Indexes
The Latest
Personal Consumption Expenditures by State, 1997-2012 (prototype statistic)
Today, the U.S. Bureau of Economic Analysis released prototype estimates of personal consumption expenditures (PCE) for states for 1997-2012. These new estimates provide insight into household spending patterns across states that can be used together with other regional data to gain a better understanding of regional economies.
June 2014 Trade Gap is $41.5 Billion
The U.S. monthly international trade deficit decreased in June 2014 according to the U.S. Bureau of Economic Analysis and the U.S. Census Bureau. The deficit decreased from $44.7 billion in May (revised) to $41.5 billion in June as exports increased and imports decreased. The previously published May deficit was $44.4 billion. The goods deficit decreased $3.0 billion from May to $60.3 billion in June; the services surplus increased $0.1…
BEA's New Statistical Product Enriches Understanding of Consumer Behavior at the State Level
On August 7th, the Commerce Department’s Bureau of Economic Analysis (BEA) will premiere a new report on consumer spending, “Personal Consumption Expenditures by State.” This represents a major advancement in the level of information available on consumer spending behaviors at the sub-national level. Why is it important? Because consumer spending is a major driver of the U.S. economy’s overall health.
U.S. International Trade in Goods and Services, June 2014
NOTE: See the navigation bar at the right side of the news release text for a link to an important note about recent changes to goods and services that were implemented in June as part of BEA's comprehensive restructuring of the International Economic Accounts. Also see links to data tables, contact personnel and their telephone numbers, and supplementary materials.
-->
Coming Soon: Data on Consumer Spending by State
Is consumer spending growing faster in North Dakota or North Carolina? How do consumers in different regions respond to economic downturns? Which state has the fastest growing consumer market for motor vehicles?
On August 7, new BEA data on consumer spending broken out by state will help businesses, consumers, and policymakers answer those questions. The statistics will cover the years from 1997 to 2012.
Real Consumer Spending Picks Up In June
Personal income rose 0.4 percent in June and in May. Wages and salaries rose 0.4 percent in June and in May.
Current-dollar disposable personal income (DPI), after-tax income, rose 0.4 percent in June and in May.
Real DPI, income adjusted for taxes and inflation, increased 0.2 percent in June and in May.
Personal Income and Outlays, June 2014; Revised estimates 1999 through May 2014
Personal income increased $56.7 billion, or 0.4 percent, and disposable personal income (DPI) increased $51.5 billion, or 0.4 percent, in June, according to the Bureau of Economic Analysis. Personal consumption expenditures (PCE) increased $51.7 billion, or 0.4 percent. In May, personal income increased $57.4 billion, or 0.4 percent, DPI increased $55.0 billion, or 0.4 percent, and PCE increased $39.8 billion, or 0.3 percent, based on revised…
Detailed Direct Investment Data Now Available for 2013
The U.S. Bureau of Economic Analysis (BEA) has released additional statistics on U.S. direct investment abroad – or “outward direct investment” – and on foreign direct investment in the United States – or “inward direct investment” for 2013 and revised statistics for 2011 and 2012.
GDP Turns Up in Second Quarter
Real gross domestic product (GDP) increased 4.0 percent in the second quarter of 2014, according to the “advance” estimate released today by the Bureau of Economic Analysis. In the first quarter, real GDP decreased 2.1 percent (revised).
Second-quarter highlights The upturn in real GDP growth was mainly driven by upturns in exports and in private nonfarm inventory investment as well as an acceleration in consumer spending, notably for…
Gross Domestic Product, 2nd quarter 2014 (advance estimate); Includes historical revisions
National Income and Product Accounts Gross Domestic Product: Second Quarter 2014 (Advance Estimate) Annual Revision: 1999 through First Quarter 2014


