Bureau of Economic Analysis
New Foreign Direct Investment in the United States, 2024
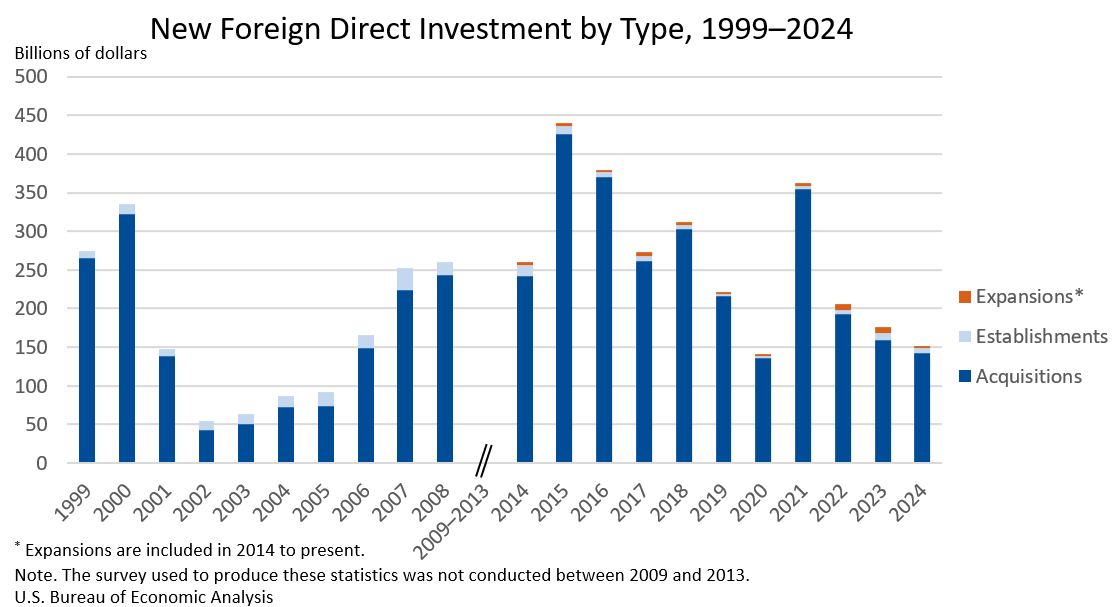
Expenditures by foreign direct investors to acquire, establish, or expand U.S. businesses totaled $151.0 billion in 2024, according to preliminary statistics released today by the U.S. Bureau of Economic Analysis. Expenditures decreased $24.9 billion, or 14.2 percent, from $176.0 billion (revised) in 2023 and were below the annual average of $277.2 billion for 2014–2023. As in previous years, acquisitions of existing U.S. businesses accounted for most of the expenditures.
Principal Federal Economic Indicators
Noteworthy
- 2025 News Release Schedule
- Innovation at BEA
- 2025 Annual Updates
- New! Services Trade Data for More Countries
- Data Tool: Trade in Value Added
- Distribution of State Personal Income
- Updated: RIMS II Regional Multipliers
- Arts and Culture
- Space Economy
- FDI Now in State BEARFACTS
- Quick Guide: Price Indexes
The Latest
New Commerce Department report explores huge benefits, low cost of government data
Today we are pleased to roll out an important new Commerce Department report on government data. “Fostering Innovation, Creating Jobs, Driving Better Decisions The Value of Government Data,” arrives as our society increasingly focuses on how the intelligent use of data can make our businesses more competitive, our governments smarter, and our citizens better informed.
5 Q's for U.S. Department of Commerce's Under Secretary of Economic Affairs Mark Doms
The Center for Data Innovation spoke with Mark Doms, Under Secretary of Economic Affairs at the U.S. Department of Commerce, in Washington, DC. Under Secretary Doms discussed the current efforts at the Commerce Department to increase the availability and timeliness of high-quality data, as well as promote data-driven innovation in the government and economy.
This interview has been lightly edited.
Looking for Economic Information on Coastal Areas? Visit BEA's Website
How much economic activity is generated by a state in a coastal area? How much do people living in coastal areas earn?
A visit to BEA’s Economic Information for Coastal Areas section on its website provides you with that information – and much more.
May 2014 Trade Gap is $44.4 Billion
The U.S. monthly international trade deficit decreased in May 2014 according to the U.S. Bureau of Economic Analysis and the U.S. Census Bureau. The deficit decreased from $47.0 billion in April (revised) to $44.4 billion in May as exports increased and imports decreased. The previously published April deficit was $47.2 billion. The goods deficit decreased $2.4 billion from April to $63.3 billion in May; the services surplus increased $0.3…
BEA to Release Modified Regional Input-Output Model in 2015
The Bureau of Economic Analysis plans to release in 2015 a modified economic model to replace the original Regional Input-Output Modeling System (RIMS II). Cost savings will be realized because the modified model will be updated less frequently.
Much like RIMS II, the modified model will produce regional “multipliers” that can be used in economic impact studies to estimate the total economic impact of a project on a region.
U.S. International Trade in Goods and Services, May 2014
NOTE: See the navigation bar at the right side of the news release text for a link to an important note about revisions to goods and services and the comprehensive restructuring of the International Economic Accounts. Also see links to data tables, contact personnel and their telephone numbers, and supplementary materials.
-->
Value of U.S. Assets Decreased but Value of U.S. Liabilities Increased in First Quarter 2014
The U.S. net international investment position was -$5,539.3 billion (preliminary) at the end of the first quarter of 2014 as the value of U.S. liabilities exceeded the value of U.S. assets. At the end of the fourth quarter, the net position was -$5,383.0 billion (revised).
How BEA Regional Data is Used to Distribute Federal Funds to State, Local Governments
Did you know that each year BEA regional economic statistics, such as annual personal income and per capita personal income are used to allocate billions of dollars in federal funds to states and local governments? In fiscal year 2013, about $308 billion in federal funds were distributed under programs using BEA statistics in funding formulas.
U.S. International Investment Position, 1st quarter 2014, year 2013, and annual revisions
Comprehensive Restructuring of the U.S. International Economic Accounts
In this release, BEA presents the U.S. international investment position (IIP) statistics for the first quarter of 2014 along with historical revisions and detailed annual statistics for 2013. These statistics include changes in positions resulting from annual financial transactions and other changes in position such as price changes, exchange-rate-changes, and…
Travel and Tourism Spending Turned Down in the First Quarter of 2014
Real spending on travel and tourism turned down in the first quarter of 2014, decreasing at an annual rate of 1.0 percent after increasing 4.5 percent (revised) in the fourth quarter of 2013. Growth in real gross domestic product (GDP) also experienced a down turn, decreasing 2.9 percent (third estimate) in the first quarter after increasing 2.6 percent in the fourth quarter.


