Bureau of Economic Analysis
U.S. International Trade in Goods and Services, June 2025
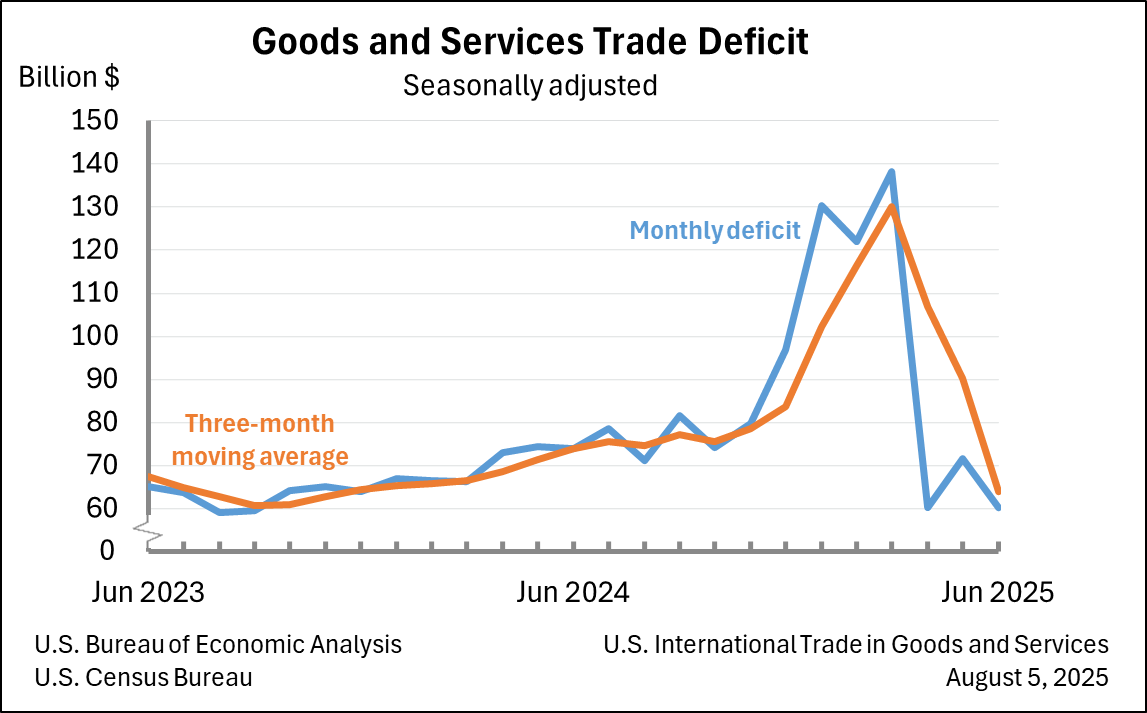
The U.S. goods and services trade deficit decreased in June 2025 according to the U.S. Bureau of Economic Analysis and the U.S. Census Bureau. The deficit decreased from $71.7 billion in May (revised) to $60.2 billion in June, as exports decreased less than imports. The goods deficit decreased $11.4 billion in June to $85.9 billion. The services surplus increased $0.1 billion in June to $25.7 billion.
Principal Federal Economic Indicators
Noteworthy
- 2025 News Release Schedule
- Innovation at BEA
- 2025 Annual Updates
- New! Services Trade Data for More Countries
- Data Tool: Trade in Value Added
- Distribution of State Personal Income
- Updated: RIMS II Regional Multipliers
- Arts and Culture
- Space Economy
- FDI Now in State BEARFACTS
- Quick Guide: Price Indexes
The Latest
State Personal Income: First Quarter 2014
State personal income increased 0.8 percent on average in the first quarter of 2014, an acceleration from the 0.5 percent growth in the fourth quarter of 2013. Personal income grew in 46 states and growth accelerated in 24 of those states. The fastest growth, 1.4 percent, was in Washington state, Vermont, and West Virginia. Personal income fell 2.9 percent in North Dakota, 0.3 percent in South Dakota, and 0.2 percent in Arkansas and Nebraska.
State Quarterly Personal Income, 1st quarter 2013-1st quarter 2014
State personal income increased 0.8 percent on average in the first quarter of 2014, an acceleration from the 0.5 percent growth in the fourth quarter of 2013, according to estimates released today by the U.S. Bureau of Economic Analysis. Personal income grew in 46 states and growth accelerated in 24 of those states. The fastest growth, 1.4 percent, was in Washington state, Vermont, and West Virginia. Personal income fell 2.9 percent in…
BEA Listens to Customers' Ideas on How to Unleash Data
As one of the federal government’s premier producers of economic statistics, the Bureau of Economic Analysis is all about data all of the time. So we were thrilled to take part in the inaugural Open Data Roundtable at the White House Conference Center on June 18 and hear from businesses and other vital customers about how we can make our data easier to find, use and understand.
A Big Day for Big Data: The Beginning of Our Data Transformation
Wednesday, June 18, 2014, was a big day for big data. The Commerce Department participated in the inaugural Open Data Roundtable at the White House, with GovLab at NYU and the White House Office of Science and Technology Policy. The event brought businesses and non-profit organizations that rely on Commerce data together with Commerce Department officials to discuss how to make the data we collect and release easier to find, understand and…
U.S. Current-Account Deficit Increases in First Quarter 2014
The U.S. current-account deficit—a net measure of transactions between the United States and the rest of the world in goods, services, primary income (investment income and compensation), and secondary income (current transfers)—increased to $111.2 billion (preliminary) in the first quarter of 2014 from $87.3 billion (revised) in the fourth quarter of 2013. As a percent of current-dollar GDP, the deficit increased to 2.6 percent from 2.0…
International Statistical Update: Health- and Education-Related Travel Now Part of Travel Services
You may have noticed some data on international travel services look a little bit different. With the release of the monthly trade report on June 4, spending on health- and education-related travel are now counted in the travel services category. Previously, both were included in a category called “other personal services.”
Attention Developers: More Economic Statistics Added to BEA's API
Developers, do you want to bring more detailed economic data to your next app? The Bureau of Economic Analysis (BEA) recently added several data sets to the application programming interface (API) we launched last year.
The API now provides direct access to the gross domestic product (GDP) underlying detail tables. Those tables contain a wealth of statistics, including how much consumers spend on hundreds of items like furnishings,…
Advance GDP by State Statistics: Widespread But Slower Growth in 2013
Real GDP increased in 49 states in 2013. Leading industry contributors were nondurable-goods manufacturing; real estate and rental and leasing; and agriculture, forestry, fishing, and hunting. Nondurable-goods manufacturing was the largest contributor to U.S. real GDP by state growth in 2013.
Gross Domestic Product by State, 2013 (advance estimate) and 1997-2012 (revised estimates)
Advance 2013 and Revised 1997—2012 Statistics of GDP by State
Real gross domestic product (GDP) increased in 49 states in 2013, according to new statistics released today by the Bureau of Economic Analysis (BEA).1 Nondurable–goods manufacturing; real estate and rental and leasing; and agriculture, forestry, fishing, and hunting were the leading contributors to real U.S. economic growth. U.S. real GDP growth slowed to 1.8 percent in 2013…


