Bureau of Economic Analysis
U.S. International Trade in Goods and Services, June 2025
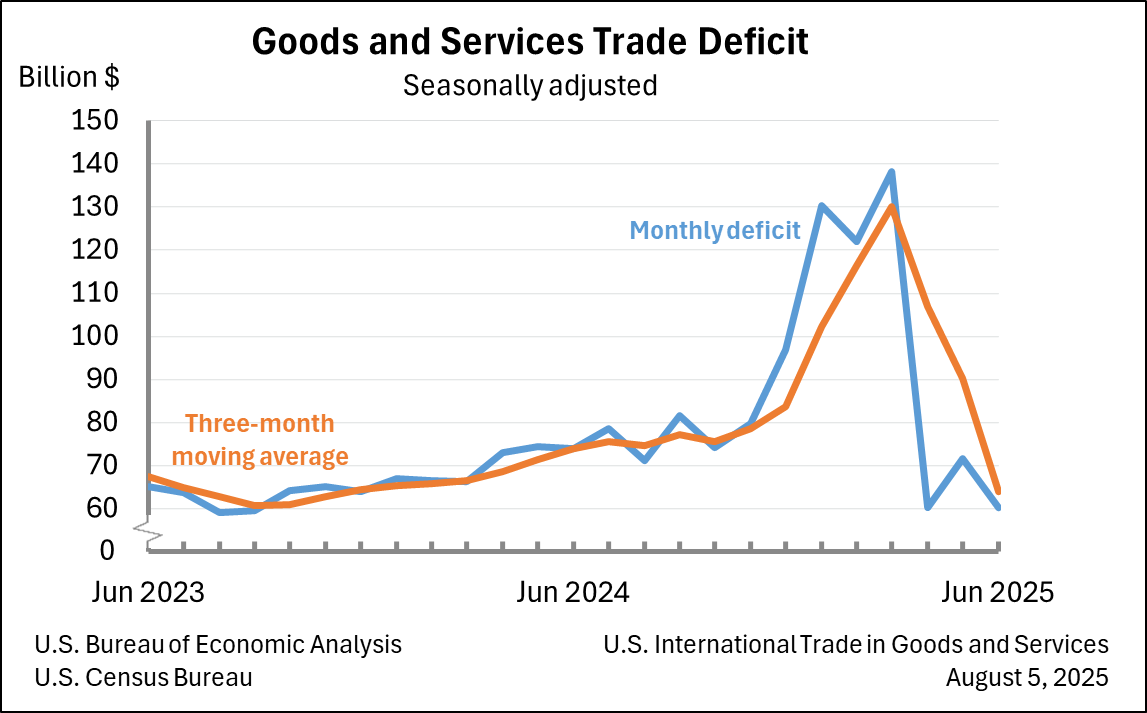
The U.S. goods and services trade deficit decreased in June 2025 according to the U.S. Bureau of Economic Analysis and the U.S. Census Bureau. The deficit decreased from $71.7 billion in May (revised) to $60.2 billion in June, as exports decreased less than imports. The goods deficit decreased $11.4 billion in June to $85.9 billion. The services surplus increased $0.1 billion in June to $25.7 billion.
Principal Federal Economic Indicators
Noteworthy
- 2025 News Release Schedule
- Innovation at BEA
- 2025 Annual Updates
- New! Services Trade Data for More Countries
- Data Tool: Trade in Value Added
- Distribution of State Personal Income
- Updated: RIMS II Regional Multipliers
- Arts and Culture
- Space Economy
- FDI Now in State BEARFACTS
- Quick Guide: Price Indexes
The Latest
GDP Growth Slows in Fourth Quarter
Real gross domestic product (GDP) increased 0.1 percent in the fourth quarter of 2012 after increasing 3.1 percent in the third quarter, according to estimates released by the Bureau of Economic Analysis. The fourth-quarter growth rate was revised up 0.2 percentage point from the advance estimate released in January. Real GDP increased 2.2 percent in 2012 after increasing 1.8 percent in 2011.
Fourth-quarter highlights The following…
Gross Domestic Product, 4th quarter and annual 2012 (second estimate)
Real gross domestic product -- the output of goods and services produced by labor and property located in the United States -- increased at an annual rate of 0.1 percent in the fourth quarter of 2012 (that is, from the third quarter to the fourth quarter), according to the "second" estimate released by the Bureau of Economic Analysis. In the third quarter, real GDP increased 3.1 percent. The GDP estimate released today is based…
Growth Continues Across the Nation's Metropolitan Areas
Metropolitan areas accounted for nearly 90 percent of national current-dollar gross domestic product (GDP). The ten largest metropolitan areas accounted for 38 percent of national GDP in 2011, while the smallest 79 metropolitan areas accounted for 2 percent of national GDP.
Gross Domestic Product by Metropolitan Area, 2011 and Revised 2001-2010
ECONOMIC GROWTH CONTINUES ACROSS METROPOLITAN AREAS IN 2011
Advance 2011, and Revised 20012010 GDP-by-Metropolitan-Area Statistics
Tracking Global Investment: Who Owns What—and Where
How much does the United States own abroad? And how does that stack up against what foreign investors own in this country? Tracking the ownership and value of trillions of dollars’ worth of financial assets like stocks, bonds, loans, and cash in bank accounts to come up with answers to these very questions is the work of skilled financial sleuths at the U.S. Bureau of Economic Analysis (BEA).
December 2012 Trade Gap is $38.5 Billion
The U.S. monthly international trade deficit decreased in December 2012, according to the U.S. Bureau of Economic Analysis and the U.S. Census Bureau. The deficit decreased from $48.6 billion (revised) in November to $38.5 billion in December, as exports increased and imports decreased. The previously published November deficit was $48.7 billion. The goods deficit decreased $9.4 billion from November to $56.2 billion in December, and the…
Personal Income Rises in December
Personal income increased 2.6 percent in December after increasing 1.0 percent in November. Accelerated bonus payments of $30 billion (at an annual rate) in December and $15 billion in November boosted wages and salaries. Accelerated dividend payments of $291.0 billion in December and $25.8 billion in November, made in anticipation of tax law changes, boosted personal dividend income.
Current-dollar disposable personal income (…
Personal Income and Outlays, December 2012
Personal income increased $352.4 billion, or 2.6 percent, and disposable personal income (DPI) increased $331.3 billion, or 2.7 percent, in December, according to the Bureau of Economic Analysis. Personal consumption expenditures (PCE) increased $22.6 billion, or 0.2 percent. In November, personal income increased $135.8 billion, or 1.0 percent, DPI increased $125.5 billion, or 1.0 percent, and PCE increased $41.6 billion, or 0.4 percent,…


