Bureau of Economic Analysis
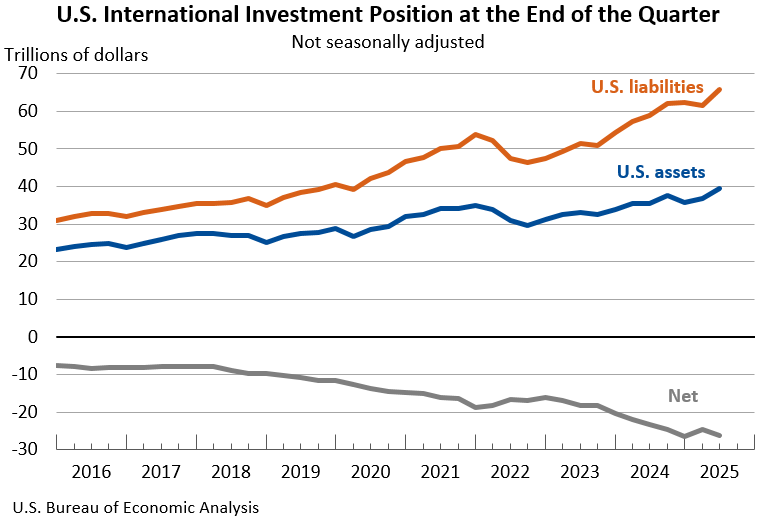
U.S. International Investment Position, 2nd Quarter 2025
The U.S. net international investment position, the difference between U.S. residents’ foreign financial assets and liabilities, was -$26.14 trillion at the end of the second quarter of 2025, according to statistics released today by the U.S. Bureau of Economic Analysis. Assets totaled $39.56 trillion, and liabilities were $65.71 trillion. At the end of the first quarter, the net investment position was -$24.65 trillion (revised).
Principal Federal Economic Indicators
Noteworthy
The Latest
Gross Domestic Product by State, 2nd Quarter 2023
Real gross domestic product (GDP) increased in 44 states and the District of Columbia in the second quarter of 2023, with the percent change ranging from 8.7 percent in Wyoming to –1.9 percent in Vermont.
Gross Domestic Product by State, 2nd Quarter 2023 and Comprehensive Update
Real gross domestic product (GDP) increased in 44 states and the District of Columbia in the second quarter of 2023, with the percent change ranging from 8.7 percent in Wyoming to –1.9 percent in Vermont.
Gross Domestic Product by Industry Second Quarter 2023 and Comprehensive Update
Today’s release presents estimates of gross domestic product (GDP) by industry and related measures for the second quarter of 2023, as well as revised quarterly estimates for the first quarter of 2018 through the first quarter of 2023 as part of the comprehensive update of the National Economic Accounts (NEAs).
Second Quarter 2023
Gross Domestic Product by Industry, 2nd Quarter 2023 and Comprehensive Update
In the second quarter, the value added of private goods-producing industries increased 7.7 percent, private services-producing industries increased 1.0 percent, and government increased 1.0 percent. Overall, 13 of 22 industry groups contributed to the 2.1 percent increase in second-quarter real GDP.
Personal Income and Outlays, October 2023
Personal income increased $57.1 billion (0.2 percent at a monthly rate) in October. Disposable personal income —personal income less personal current taxes—increased $63.4 billion (0.3 percent). Personal outlays—the sum of personal consumption expenditures, personal interest payments, and personal current transfer payments—increased $43.8 billion (0.2 percent) and consumer spending increased $41.2 billion (0.2 percent). Personal saving was $…
Personal Income and Outlays, October 2023
Personal income increased $57.1 billion (0.2 percent at a monthly rate) in October. Disposable personal income (DPI)—personal income less personal current taxes—increased $63.4 billion (0.3 percent). Personal outlays—the sum of personal consumption expenditures (PCE), personal interest payments, and personal current transfer payments—increased $43.8 billion (0.2 percent) and consumer spending increased $41.2 billion (0.2 percent). Personal…
Gross Domestic Product (Second Estimate) Corporate Profits (Preliminary Estimate) Third Quarter 2023
Real gross domestic product (GDP) increased at an annual rate of 5.2 percent in the third quarter of 2023, according to the “second” estimate. In the second quarter, real GDP increased 2.1 percent. The increase in the third quarter primarily reflected increases in consumer spending and inventory investment. Imports, which are a subtraction in the calculation of GDP, increased.
Gross Domestic Product (Second Estimate) Corporate Profits (Preliminary Estimate) Third Quarter 2023
Real gross domestic product (GDP) increased at an annual rate of 5.2 percent in the third quarter of 2023, according to the “second” estimate. In the second quarter, real GDP increased 2.1 percent. The increase in the third quarter primarily reflected increases in consumer spending and inventory investment. Imports, which are a subtraction in the calculation of GDP, increased. Profits increased 3.3 percent at a quarterly rate in the third…
Outdoor Recreation Satellite Account, U.S. and States, 2022
The value added of the outdoor recreation economy accounted for 2.2 percent of current‐dollar gross domestic product for the nation in 2022. At the state level, value added for outdoor recreation as a share of state GDP ranged from 5.6 percent in Hawaii to 1.4 percent in Connecticut. The share was 0.9 percent in the District of Columbia.
Outdoor Recreation Satellite Account, U.S. and States, 2022
The value added of the outdoor recreation economy accounted for 2.2 percent ($563.7 billion) of current‐dollar gross domestic product (GDP) for the nation in 2022. At the state level, value added for outdoor recreation as a share of state GDP ranged from 5.6 percent in Hawaii to 1.4 percent in Connecticut. The share was 0.9 percent in the District of Columbia.


