Bureau of Economic Analysis
Direct Investment by Country and Industry, 2024
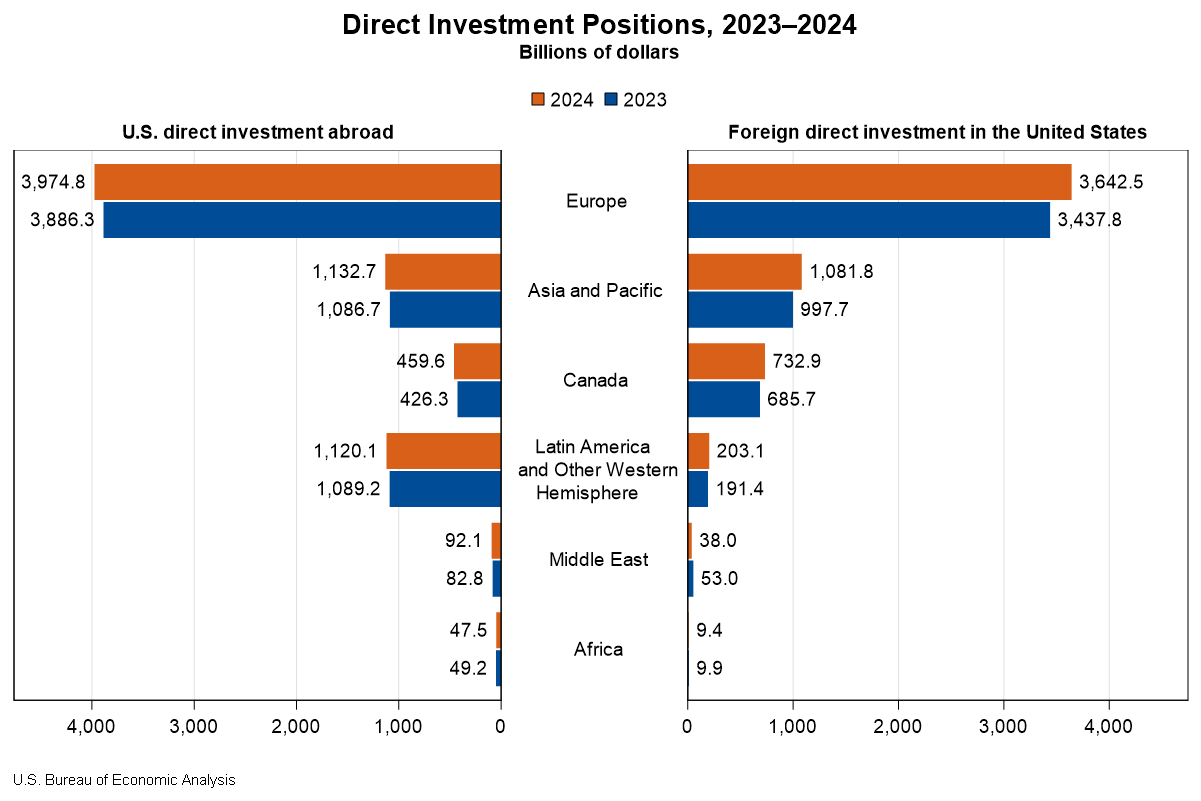
The U.S. direct investment abroad position, or cumulative level of investment, increased $206.3 billion to $6.83 trillion at the end of 2024, according to statistics released today by the U.S. Bureau of Economic Analysis. The increase was led by an $88.4 billion increase in the position in Europe, primarily in Luxembourg and Germany. By industry, manufacturing affiliates had the largest increase, led by manufacturing of computers and electronic products.
The foreign direct investment in the United States position increased $332.1 billion to $5.71 trillion at the end of 2024. The increase was led by a $204.7 billion increase in the position from Europe, which reflected a $52.9 billion increase from the United Kingdom and a $39.7 billion increase from Germany. By industry, affiliates in manufacturing increased the most.
Principal Federal Economic Indicators
Noteworthy
- 2025 News Release Schedule
- Innovation at BEA
- 2025 Annual Updates
- New! Services Trade Data for More Countries
- Data Tool: Trade in Value Added
- Distribution of State Personal Income
- Updated: RIMS II Regional Multipliers
- Arts and Culture
- Space Economy
- FDI Now in State BEARFACTS
- Quick Guide: Price Indexes
The Latest
Gross Domestic Product, 1st quarter 1999 (preliminary); Corporate Profits, 1st quarter 1999 (preliminary)
This release is also available in Adobe Acrobat (PDF) format.
Real gross domestic product -- the output of goods and services produced by labor and property located in the United States -- increased at an annual rate of 4.1 percent in the first quarter of 1999, according to preliminary estimates released by the Commerce Department's Bureau of Economic Analysis. In the fourth quarter, real GDP increased 6.0 percent. Real GDP increased…
U.S. International Trade in Goods and Services for March 1999
This release is available in multiple formats:
Adobe Acrobat (PDF) file Plain text (TXT) file1997 Local Area Personal Income for counties, metropolitan areas, and nonmetropolitan areas
1997 LOCAL AREA PERSONAL INCOME For Counties, Metropolitan Areas, and Nonmetropolitan Areas
Personal income in metropolitan counties grew 5.8 percent in 1997, substantially faster than the 4.7 percent growth of personal income in nonmetropolitan counties, according to estimates released today by the Commerce Department's Bureau of Economic Analysis. The faster metro county growth in 1997 reversed the pattern in 1996, when personal…
Gross Domestic Product, 1st quarter 1999 (advance estimate)
This release is available as an Adobe Acrobat PDF file download.
NOTE: On May 13, 1999, Table 2 of this news release was recalculated; the recalculated table is here.
State Personal Income, 4th quarter 1998 and Per Capita Personal Income, 1998 (preliminary)
You may also view this press release in Adobe Acrobat PDF format.
1998 STATE PER CAPITA PERSONAL INCOME and STATE PERSONAL INCOME (Preliminary)
North Dakota and Colorado led the nation in per capita personal income growth in 1998, according to preliminary estimates released by the Commerce Department's Bureau of Economic Analysis.
U.S. International Trade in Goods and Services for February 1999
This release is available in multiple formats:
Adobe Acrobat (PDF) file Plain text (TXT) fileGross Domestic Product, 4th quarter 1998 (final)
Many of BEA's tables are very wide. Printing tips are available.
U.S. International Trade in Goods and Services for January 1999
This release is available in multiple formats:
Adobe Acrobat (PDF) file Plain text (TXT) file


