Bureau of Economic Analysis
U.S. International Trade in Goods and Services, July 2025
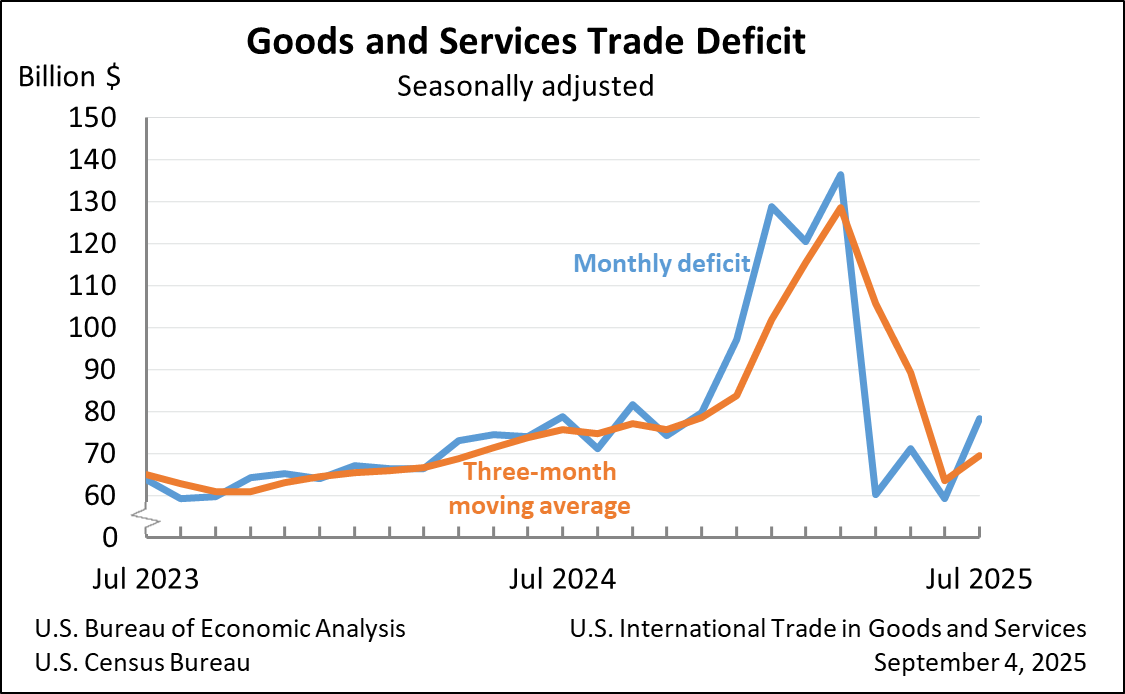
The U.S. goods and services trade deficit increased in July 2025 according to the U.S. Bureau of Economic Analysis and the U.S. Census Bureau. The deficit increased from $59.1 billion in June (revised) to $78.3 billion in July, as imports increased more than exports. The goods deficit increased $18.2 billion in July to $103.9 billion. The services surplus decreased $1.1 billion in July to $25.6 billion.
Principal Federal Economic Indicators
Noteworthy
The Latest
Gross Domestic Product, 2nd quarter 1997 (final); Corporate Profits, 2nd quarter 1997 (revised)
This release is available as a text file download.
State per capita personal income growth in 1996
This release is available as a text file download.
U.S. International Trade in Goods and Services, July 1997
This release is available as a text file download.
U.S. International Transactions, 2nd quarter 1997
This release is available as a text file download.
Personal Income and Outlays, July 1997
This release is available as a text file download.
Gross Domestic Product, 2nd quarter 1997 (preliminary); Corporate Profits, 2nd quarter 1997 (preliminary)
This release is available as a text file download.
Metropolitan Area Personal Income, 1995
This release is available as a text file download.
U.S. International Trade in Goods and Services, June 1997
This release is available as a text file download.
Personal Income and Outlays, June 1997
This release is available as a text file download.
Gross Domestic Product, 2nd quarter 1997 (advance)
This release is available as a text file download.


