
Bureau of Economic Analysis
U.S. International Trade in Goods and Services, September 2025
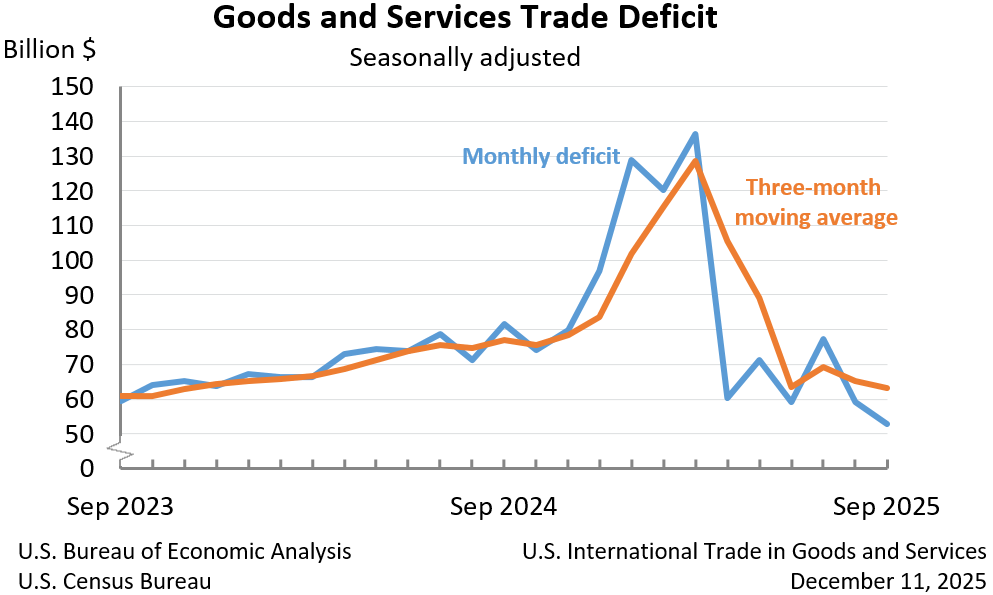
The U.S. goods and services trade deficit decreased in September 2025 according to the U.S. Bureau of Economic Analysis and the U.S. Census Bureau. The deficit decreased from $59.3 billion in August (revised) to $52.8 billion in September, as exports increased more than imports. The goods deficit decreased $7.1 billion in September to $79.0 billion. The services surplus decreased $0.6 billion in September to $26.2 billion.
Principal Federal Economic Indicators
Noteworthy


The Latest
New Foreign Direct Investment in the United States, 2021
Expenditures by foreign direct investors to acquire, establish, or expand U.S. businesses totaled $333.6 billion (preliminary) in 2021.
Gross Domestic Product by State, 1st Quarter 2022
Real gross domestic product (GDP) decreased in 46 states and the District of Columbia in the first quarter of 2022, as real GDP for the nation decreased at an annual rate of 1.6 percent. The percent change in real GDP in the first quarter ranged from 1.2 percent in New Hampshire to –9.7 percent in Wyoming.
Personal Income and Outlays, May 2022
Personal income increased $113.4 billion, or 0.5 percent at a monthly rate, while consumer spending increased $32.7 billion, or 0.2 percent, in May. The increase in personal income primarily reflected an increase in compensation. The personal saving rate (that is, personal saving as a percentage of disposable personal income) was 5.4 percent in May, compared with 5.2 percent in April.
Gross Domestic Product (Third Estimate), Corporate Profits (Revised Estimate), and GDP by Industry, First Quarter 2022
Real gross domestic product (GDP) decreased at an annual rate of 1.6 percent in the first quarter of 2022, following an increase of 6.9 percent in the fourth quarter of 2021. The decrease was revised down 0.1 percentage point from the “second” estimate released in May. In the first quarter, there was a resurgence of COVID-19 cases from the Omicron variant and decreases in government pandemic assistance payments. For more details, including…
Gross Domestic Product (Third Estimate), GDP by Industry, and Corporate Profits (Revised), First Quarter 2022
Real gross domestic product (GDP) decreased at an annual rate of 1.6 percent in the first quarter of 2022, following an increase of 6.9 percent in the fourth quarter of 2021. The decrease was revised down 0.1 percentage point from the "second" estimate released in May. In the first quarter, there was a resurgence of COVID-19 cases from the Omicron variant and decreases in government pandemic assistance payments. Profits decreased 2.…
U.S. International Investment Position, First Quarter 2022
The U.S. net international investment position, the difference between U.S. residents’ foreign financial assets and liabilities, was –$17.75 trillion at the end of the first quarter of 2022, according to statistics released today by the U.S. Bureau of Economic Analysis (BEA). Assets totaled $34.00 trillion, and liabilities were $51.75 trillion. At the end of the fourth quarter of 2021, the net investment position was –$18.12 trillion.
U.S. International Investment Position, First Quarter 2022 and Annual Update
The U.S. net international investment position (IIP), the difference between U.S. residents’ foreign financial assets and liabilities, was -$17.75 trillion at the end of the first quarter of 2022, according to statistics released today by the U.S. Bureau of Economic Analysis (BEA). Assets totaled $34.00 trillion, and liabilities were $51.75 trillion. At the end of the fourth quarter of 2021, the net investment position was -$18.12 trillion.
U.S. Current-Account Deficit Widens in First Quarter 2022
The U.S. current-account deficit, which reflects the combined balances on trade in goods and services and income flows between U.S. residents and residents of other countries, widened by $66.6 billion, or 29.6 percent, to $291.4 billion in the first quarter of 2022. The widening mostly reflected an increased deficit on goods. The first-quarter deficit was 4.8 percent of current-dollar gross domestic product, up from 3.7 percent in the fourth…