
Bureau of Economic Analysis
U.S. International Trade in Goods and Services, September 2025
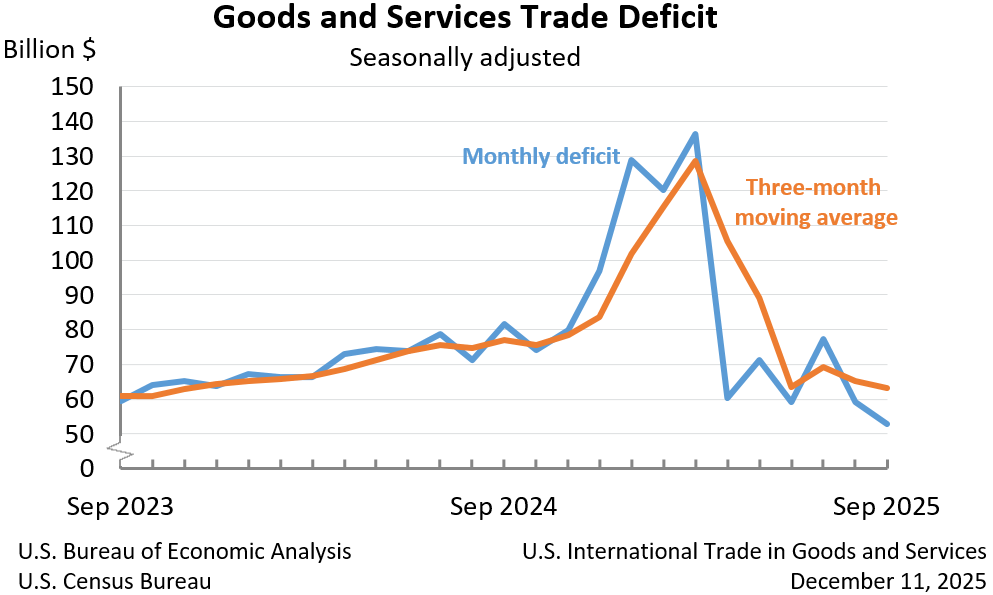
The U.S. goods and services trade deficit decreased in September 2025 according to the U.S. Bureau of Economic Analysis and the U.S. Census Bureau. The deficit decreased from $59.3 billion in August (revised) to $52.8 billion in September, as exports increased more than imports. The goods deficit decreased $7.1 billion in September to $79.0 billion. The services surplus decreased $0.6 billion in September to $26.2 billion.
Principal Federal Economic Indicators
Noteworthy


The Latest
U.S. Net International Investment Position: Third Quarter 2018
The U.S. net international investment position decreased to -$9,627.2 billion (preliminary) at the end of the third quarter of 2018 from -$8,845.1 billion (revised) at the end of the second quarter, according to statistics released by the Bureau of Economic Analysis (BEA).
New Dates Set for Some Delayed Releases
Bureau of Economic Analysis reports on the U.S. international investment position, trade in goods and services, state economies, and industry economics that were delayed by the recent lapse in federal funding will be released in February.
The new release dates:
BEA Economic Reports Delayed
Bureau of Economic Analysis reports scheduled for this week and next will be delayed because of the effects of the partial government shutdown.
Those reports are:
Real Consumer Spending Rises in November
Personal income increased 0.2 percent in November after increasing 0.5 percent in October. Wages and salaries, the largest component of personal income, increased 0.2 percent in November after increasing 0.4 percent in October.
Personal Income and Outlays, November 2018
Personal income increased 0.2 percent in November after increasing 0.5 percent in October. Wages and salaries, the largest component of personal income, increased 0.2 percent in November after increasing 0.4 percent in October.
GDP Increases in the Third Quarter
Real gross domestic product (GDP) increased 3.4 percent in the third quarter of 2018, according to the “third” estimate released by the Bureau of Economic Analysis. The growth rate was revised down 0.1 percentage point from the “second” estimate released in November. In the second quarter, real GDP increased 4.2 percent.
Gross Domestic Product, 3rd quarter 2018 (third estimate); Corporate Profits, 3rd quarter 2018 (revised estimate)
Real gross domestic product (GDP) increased 3.4 percent in the third quarter of 2018, according to the "third" estimate released by the Bureau of Economic Analysis. The growth rate was revised down 0.1 percentage point from the “second” estimate released in November. In the second quarter, real GDP increased 4.2 percent.
State Personal Income, Third Quarter 2018
State personal income increased 4.0 percent at an annual rate in the third quarter of 2018, an acceleration from the 3.4 percent increase in the second quarter. Personal income increased in all states and the District of Columbia. The percent change in personal income across all states ranged from 6.2 percent in Nevada and Washington to 2.1 percent in Missouri.
U.S. Current-Account Deficit Increases in Third Quarter 2018
The U.S. current-account deficit increased to $124.8 billion (preliminary) in the third quarter of 2018 from $101.2 billion (revised) in the second quarter of 2018. As a percentage of U.S. GDP, the deficit increased to 2.4 percent from 2.0 percent. The previously published current-account deficit for the second quarter was $101.5 billion.