
News Release
Gross Domestic Product, (Third Estimate), GDP by Industry, and Corporate Profits (Revised), 2nd Quarter 2021
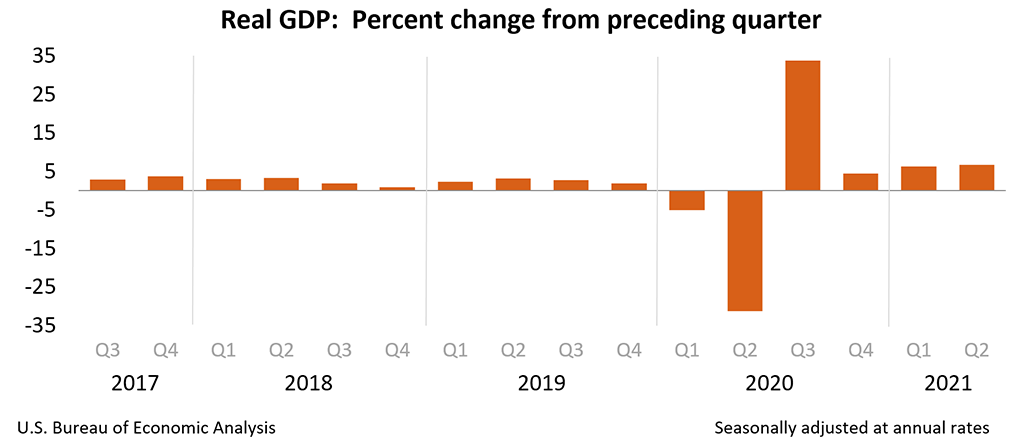
Real gross domestic product (GDP) increased at an annual rate of 6.7 percent in the second quarter of 2021 (table 1), according to the "third" estimate released by the Bureau of Economic Analysis. In the first quarter, real GDP increased 6.3 percent.
The "third" estimate of GDP released today is based on more complete source data than were available for the "second" estimate issued last month. In the second estimate, the increase in real GDP was 6.6 percent. Upward revisions to personal consumption expenditures (PCE), exports, and private inventory investment were partly offset by an upward revision to imports, which are a subtraction in the calculation of GDP (see "Updates to GDP").
The increase in real GDP in the second quarter reflected increases in PCE, nonresidential fixed investment, exports, and state and local government spending that were partly offset by decreases in private inventory investment, residential fixed investment, and federal government spending. Imports, which are a subtraction in the calculation of GDP, increased (table 2).
The increase in PCE reflected increases in services (led by food services and accommodations) and goods (led by "other" nondurable goods, notably pharmaceutical products, as well as clothing and footwear). The increase in nonresidential fixed investment reflected increases in equipment (led by transportation equipment) and intellectual property products (led by software as well as research and development). The increase in exports reflected increases in goods (led by nonautomotive capital goods) and in services (led by travel). The decrease in private inventory investment was led by a decrease in retail trade inventories. The decrease in federal government spending primarily reflected a decrease in nondefense spending on intermediate goods and services. In the second quarter, nondefense services decreased as the processing and administration of Paycheck Protection Program (PPP) loan applications by banks on behalf of the federal government declined.
Current-dollar GDP increased 13.4 percent at an annual rate, or $702.8 billion, in the second quarter to a level of $22.74 trillion. In the first quarter, GDP increased 10.9 percent, or $560.6 billion (table 1 and table 3). More information on the source data that underlie the estimates is available in the Key Source Data and Assumptions file on BEA's website.
The price index for gross domestic purchases increased 5.8 percent in the second quarter, unrevised from the second estimate (table 4). The PCE price index increased 6.5 percent, unrevised from the second estimate. Excluding food and energy prices, the PCE price index increased 6.1 percent, unrevised from the second estimate.
Gross Domestic Income and Corporate Profits
Real gross domestic income (GDI) increased 2.3 percent in the second quarter, compared with an increase of 6.3 percent in the first quarter. The average of real GDP and real GDI, a supplemental measure of U.S. economic activity that equally weights GDP and GDI, increased 4.5 percent in the second quarter, compared with an increase of 6.3 percent in the first quarter (table 1).
Profits from current production (corporate profits with inventory valuation and capital consumption adjustments) increased $267.8 billion in the second quarter, compared with an increase of $123.9 billion in the first quarter (table 10).
Profits of domestic financial corporations increased $52.8 billion in the second quarter, compared with an increase of $1.3 billion in the first quarter. Profits of domestic nonfinancial corporations increased
$221.3 billion, compared with an increase of $133.2 billion. Rest-of-the-world profits decreased $6.2 billion, compared with a decrease of $10.6 billion. In the second quarter, receipts increased $27.4 billion, and payments increased $33.6 billion.
Updates to GDP
In the third estimate for the second quarter, real GDP increased 6.7 percent, an upward revision of 0.1 percentage point. The revision primarily reflected upward revisions to PCE, exports, private inventory investment, that were partly offset by an upward revision to imports and downward revisions to residential fixed investment, state and local government spending, and federal government spending. For more information, see the Technical Note and the "Additional Information" section that follows.
| Advance Estimate | Second Estimate | Third Estimate | |
|---|---|---|---|
| (Percent change from preceding quarter) | |||
| Real GDP | 6.5 | 6.6 | 6.7 |
| Current-dollar GDP | 13.0 | 13.2 | 13.4 |
| Real GDI | … | 1.6 | 2.3 |
| Average of Real GDP and Real GDI | … | 4.0 | 4.5 |
| Gross domestic purchases price index | 5.7 | 5.8 | 5.8 |
| PCE price index | 6.4 | 6.5 | 6.5 |
| PCE price index excluding food and energy | 6.1 | 6.1 | 6.1 |
Real GDP by Industry
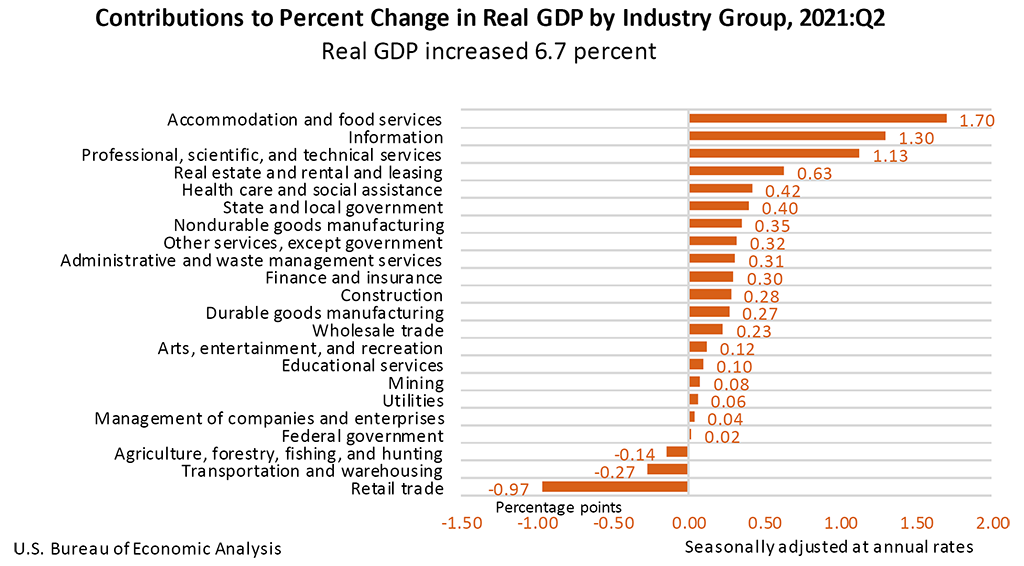
Today's release includes estimates of GDP by industry, or value added—a measure of an industry's contribution to GDP. In the second quarter, private goods-producing industries increased 4.7 percent, private services-producing industries increased 7.8 percent, and government increased 3.4 percent (table 12). Overall, 19 of 22 industry groups contributed to the second-quarter increase in real GDP.
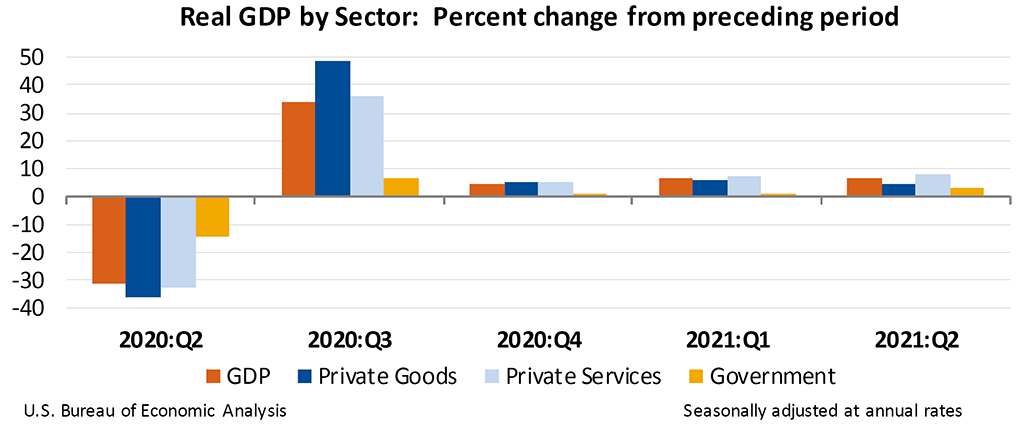
The increase in private goods-producing industries primarily reflected increases in nondurable goods manufacturing (led by petroleum and coal products), construction, and durable goods manufacturing (led by other transportation equipment).
The increase in private services-producing industries primarily reflected increases in accommodation and food services; information (led by data processing, internet publishing, and other information services); professional, scientific, and technical services; real estate and rental and leasing; and healthcare and social assistance (led by ambulatory health care services). These increases were partly offset by a decrease in retail trade (led by motor vehicle and parts dealers) (table 13).
The increase in government mainly reflected an increase in state and local government.
Gross Output by Industry
Real gross output—principally a measure of an industry's sales or receipts, which includes sales to final users in the economy (GDP) and sales to other industries (intermediate inputs)—increased 5.5 percent in the second quarter. Private services-producing industries increased 9.5 percent, while private goods- producing industries decreased 2.5 percent and government decreased 1.6 percent (table 16). Overall, 14 of 22 industry groups contributed to the increase in real gross output.
Annual Update of the Industry Economic Accounts
The industry estimates released today reflect the results of the 2021 Annual Update of the Industry Economic Accounts (IEAs). The update covers 1999 through the first quarter of 2021. The reference year remains 2012. Today's update incorporates the results from the 2021 Annual Update of the National Income and Product Accounts (NIPAs) which included improvements for housing services and financial services. For details on methodology improvements as well as major source data incorporated see The 2021 Annual Update of the National Income and Product Accounts in the August Survey of Current Business.
This update includes several improvements that better align the IEAs and the NIPAs. Estimates of industry gross operating surplus were improved for the most recent year by making more direct use of GDI by industry data; estimates for motor vehicle and parts manufacturers were better aligned with NIPA motor vehicle output by using the same underlying Wards Intelligence data; and estimates for utilities were changed to rely directly on quantity data from the Energy Information Administration, consistent with estimates of utilities in PCE services.
The full results of the annual update of the industry economic accounts, including updated annual supply-use tables, can be found on the BEA website. Additional information will be available in an article in the forthcoming issue of the Survey of Current Business.
* * *
Next release, October 28, 2021 at 8:30 A.M. EDT
Gross Domestic Product, Third Quarter 2021 (Advance Estimate)