BEA 27-20
Scheduled Date
June 24 08:30:am
Release Title
U.S. International Transactions and Investment Position, 1st Quarter 2027 and Annual Update

An official website of the United States government
|
Q2 2026
|
-$246.0 B
|
|
Q1 2026
|
-$212.6 B
|
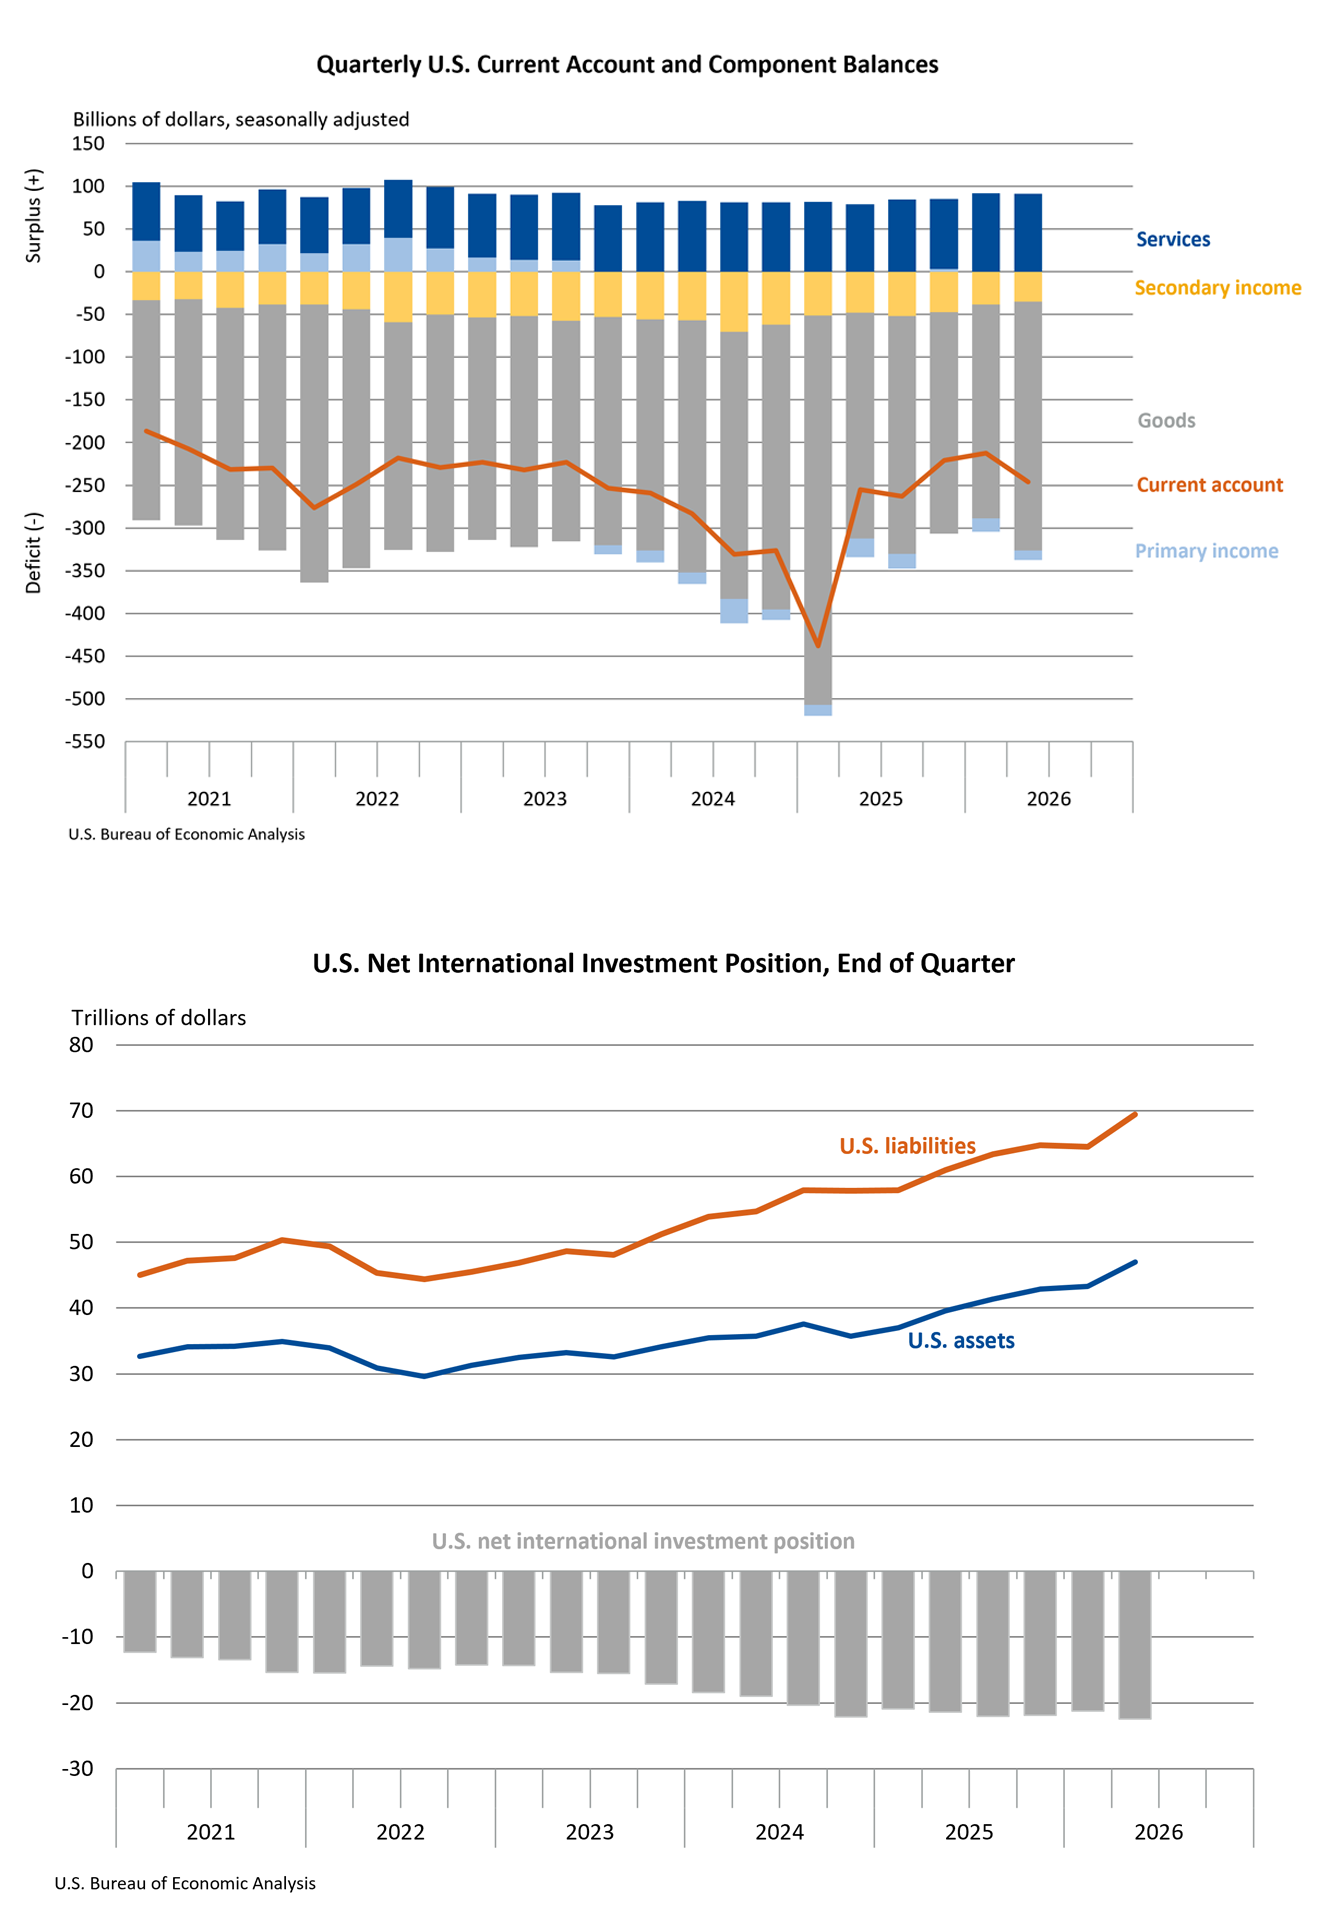
The U.S. current-account deficit resulting from international economic transactions widened by $33.4 billion, or 15.7 percent, to $246.0 billion in the second quarter of 2026, according to statistics released today by the U.S. Bureau of Economic Analysis. The revised first-quarter deficit was $212.6 billion. The second-quarter deficit was 3.0 percent of current-dollar gross domestic product, up from 2.7 percent in the first quarter.
End of Q2 2026 | -$22.42 T |
End of Q1 2026 | -$21.27 T |
The U.S. net international investment position, the difference between U.S. residents’ foreign financial assets and liabilities, was –$22.42 trillion at the end of the second quarter of 2026. Assets totaled $46.97 trillion, and liabilities totaled $69.39 trillion. At the end of the first quarter of 2026, the net investment position was –$21.27 trillion (revised).
|
Q1 2026
|
-$226.8 B
|
|
Q4 2025
|
-$221.1 B
|
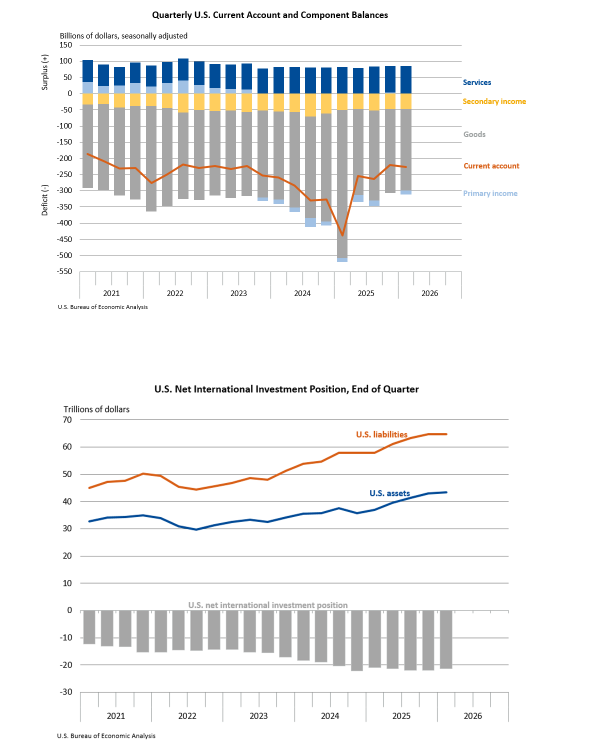
The U.S. current-account deficit resulting from international economic transactions widened by $5.8 billion, or 2.6 percent, to $226.8 billion in the first quarter of 2026, according to statistics released today by the U.S. Bureau of Economic Analysis. The revised fourth-quarter deficit was $221.1 billion. The first-quarter deficit was 2.9 percent of current-dollar gross domestic product, up from 2.8 percent in the fourth quarter.
End of Q1 2026 | -$21.27 T |
End of Q4 2025 | -$21.87 T |
The U.S. net international investment position, the difference between U.S. residents’ foreign financial assets and liabilities, was –$21.27 trillion at the end of the first quarter of 2026. Assets totaled $43.37 trillion, and liabilities totaled $64.64 trillion. At the end of the fourth quarter of 2025, the net investment position was –$21.87 trillion (revised).
|
Q4 2025
|
-$190.7 B
|
|
Q3 2025
|
-$239.1 B
|
The U.S. current-account deficit resulting from international economic transactions narrowed by $48.4 billion, or 20.2 percent, to $190.7 billion in the fourth quarter of 2025, according to statistics released today by the U.S. Bureau of Economic Analysis. The revised third-quarter deficit was $239.1 billion. The fourth-quarter deficit was 2.4 percent of current-dollar gross domestic product, down from 3.1 percent in the third quarter.
End of Q4 2025 | -$27.54 T |
End of Q3 2025 | -$27.55 T |
The U.S. net international investment position, the difference between U.S. residents’ foreign financial assets and liabilities, was –$27.54 trillion at the end of the fourth quarter of 2025. Assets totaled $42.96 trillion, and liabilities totaled $70.49 trillion. At the end of the third quarter, the net investment position was –$27.55 trillion (revised).
|
Q3 2025
|
-$226.4 B
|
|
Q2 2025
|
-$249.2 B
|
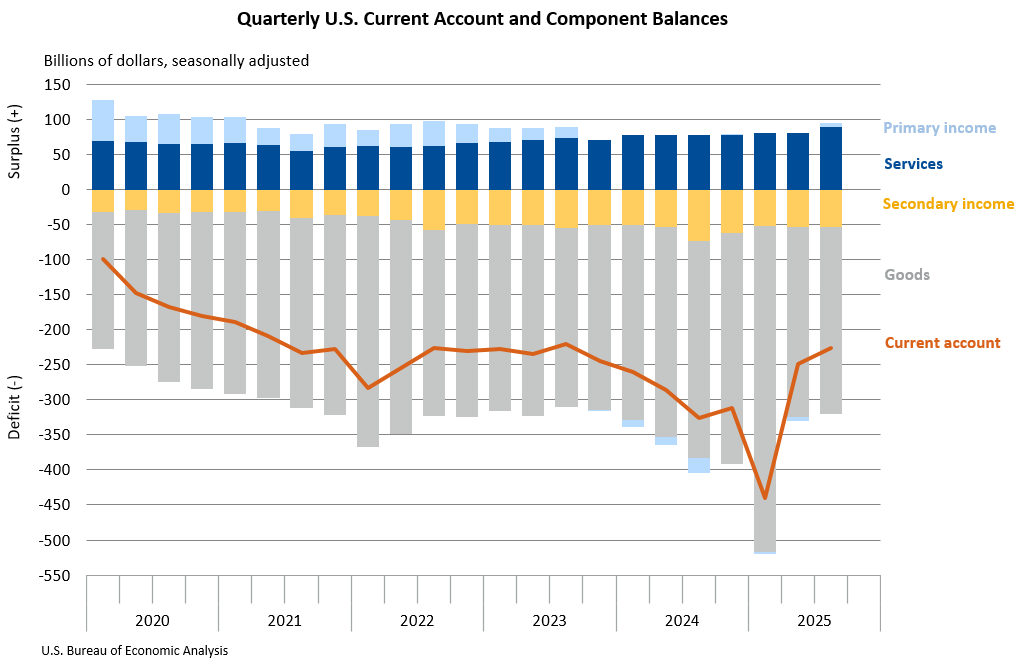
The U.S. current-account deficit narrowed by $22.8 billion, or 9.2 percent, to $226.4 billion in the third quarter of 2025, according to statistics released today by BEA. The revised second-quarter deficit was $249.2 billion. The third-quarter deficit was 2.9 percent of current-dollar gross domestic product, down from 3.3 percent in the second quarter.