BEA 22-67
Scheduled Date
December 29 08:30:am
Release Title
U.S. International Investment Position, 3rd Quarter 2022

An official website of the United States government
|
End of 4th quarter 2021:
|
–$18.10 trillion
|
|
End of 3rd quarter 2021:
|
–$16.35 trillion
|
|
End of year 2021:
|
–$18.10 trillion
|
|
End of year 2020:
|
–$14.01 trillion
|
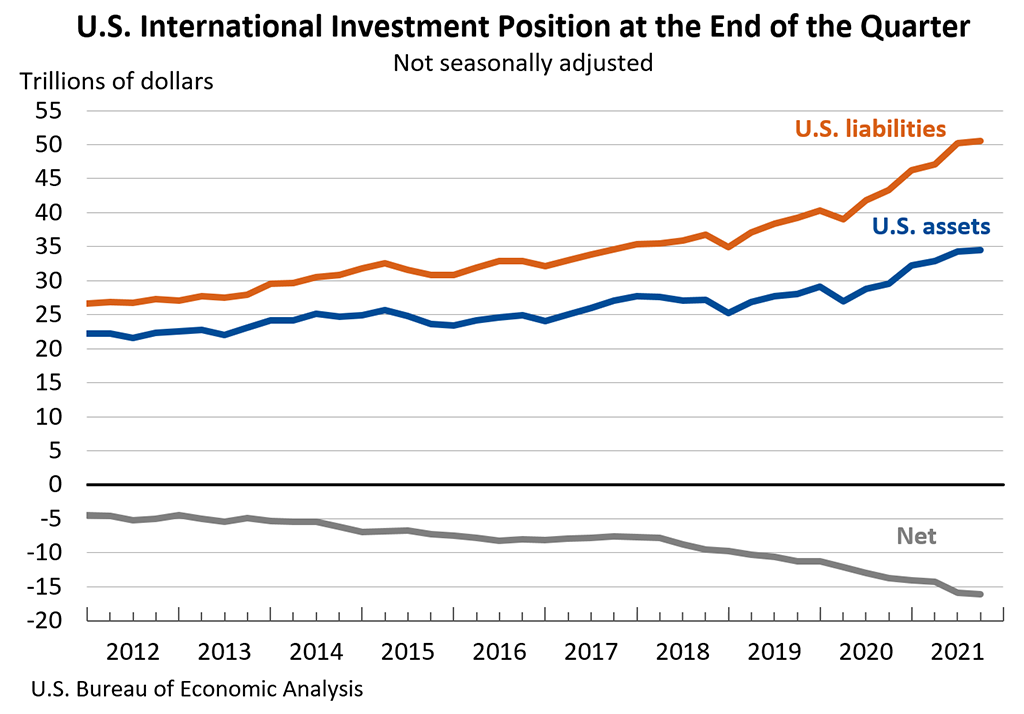
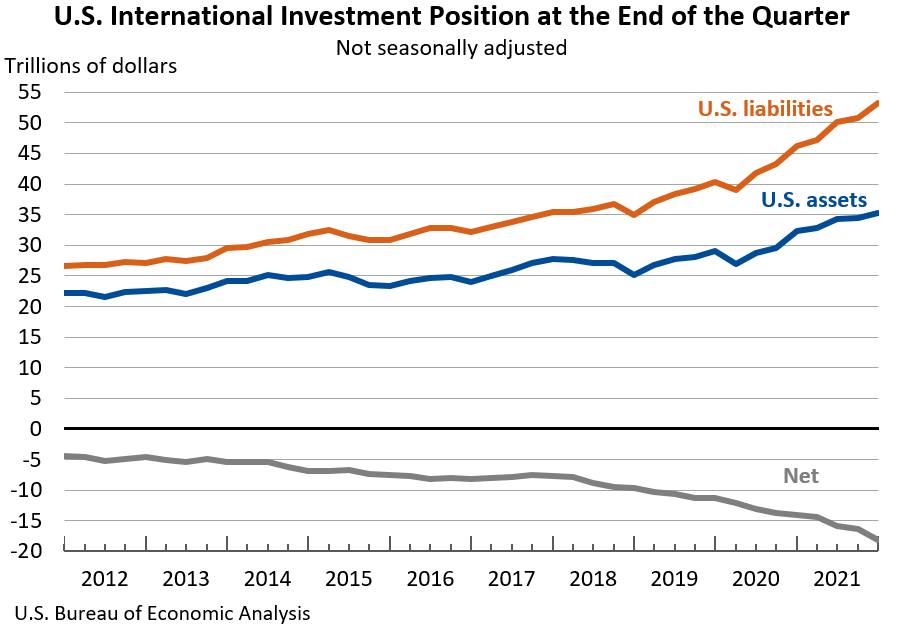
The U.S. net international investment position (IIP), the difference between U.S. residents’ foreign financial assets and liabilities, was –$18.10 trillion at the end of the fourth quarter of 2021, according to statistics released today by the U.S. Bureau of Economic Analysis (BEA). Assets totaled $35.21 trillion, and liabilities were $53.31 trillion. At the end of the third quarter, the net investment position was –$16.35 trillion.
|
End of 3rd quarter 2021
|
-$16.07 trillion
|
|
End of 2nd quarter 2021
|
-$15.91 trillion
|
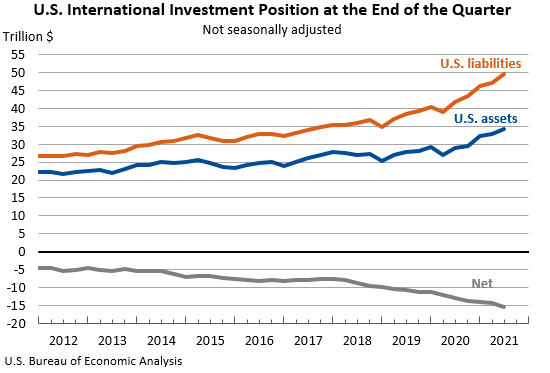
The U.S. net international investment position (IIP), the difference between U.S. residents' foreign financial assets and liabilities, was –$16.07 trillion at the end of the third quarter of 2021, according to statistics released today by the U.S. Bureau of Economic Analysis (BEA). Assets totaled $34.45 trillion, and liabilities were $50.53 trillion. At the end of the second quarter, the net investment position was –$15.91 trillion.
|
End of 2nd quarter 2021:
|
-$15.42 trillion
|
|
End of 1st quarter 2021:
|
-$14.30 trillion
|
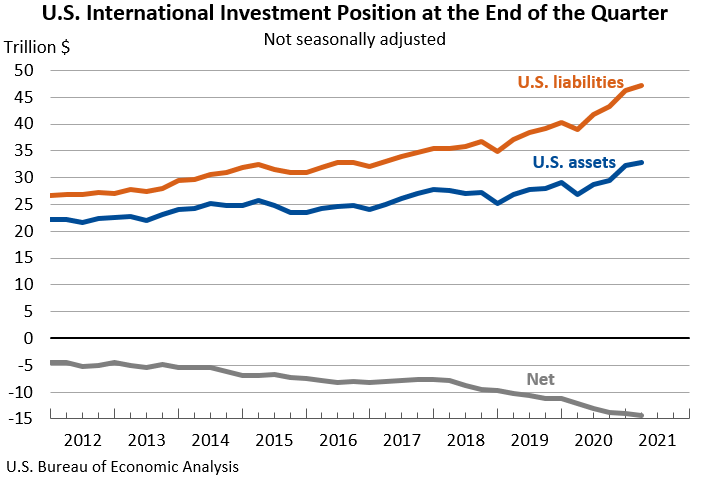
The U.S. net international investment position, the difference between U.S. residents’ foreign financial assets and liabilities, was –$15.42 trillion at the end of the second quarter of 2021, according to statistics released by the U.S. Bureau of Economic Analysis (BEA). Assets totaled $34.20 trillion and liabilities were $49.62 trillion. At the end of the first quarter, the net investment position was –$14.30 trillion.
|
End of 1st quarter 2021:
|
-$14.32 trillion
|
|
End of 4th quarter 2020:
|
-$14.01 trillion
|
|
End of year 2020:
|
-$14.01 trillion
|
|
End of year 2019:
|
-$11.23 trillion
|
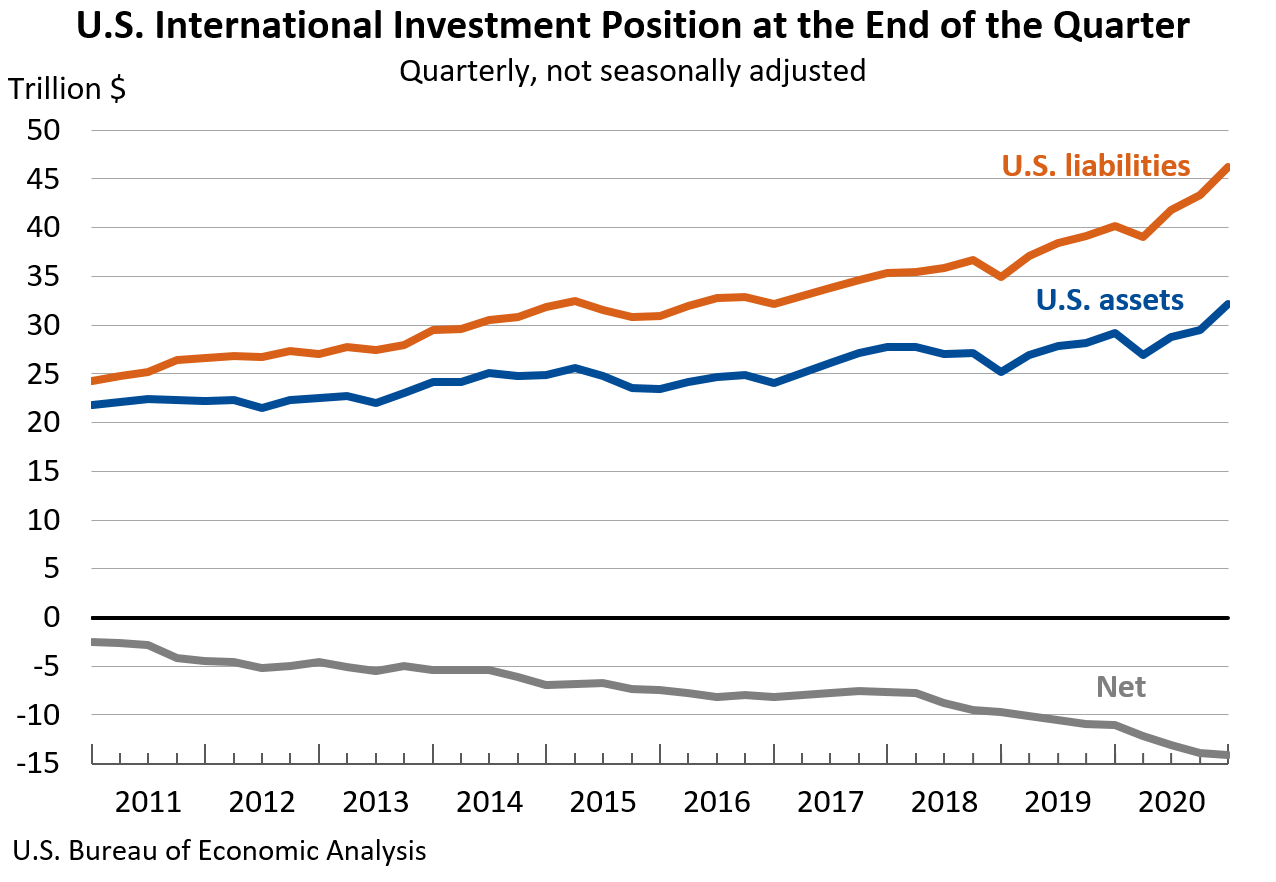
The U.S. net international investment position, the difference between U.S. residents’ foreign financial assets and liabilities, was –$14.32 trillion at the end of the first quarter of 2021, according to statistics released by the U.S. Bureau of Economic Analysis (BEA). Assets totaled $32.81 trillion and liabilities were $47.13 trillion. At the end of the fourth quarter of 2020, the net investment position was –$14.01 trillion.
|
End of 4th quarter 2020
|
–$14.09 trillion
|
|
End of 3rd quarter 2020
|
–$13.86 trillion
|
|
End of year 2020
|
–$14.09 trillion
|
|
End of year 2019
|
–$11.05 trillion
|
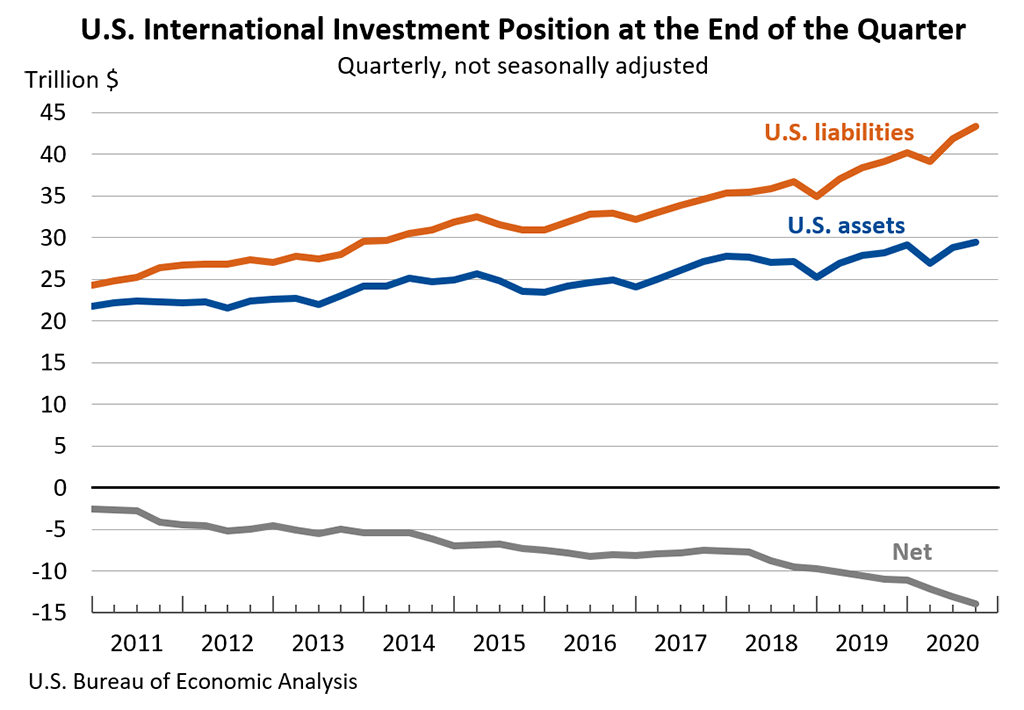
The U.S. net international investment position, the difference between U.S. residents’ foreign financial assets and liabilities, was –$14.09 trillion at the end of the fourth quarter of 2020, according to statistics released by the U.S. Bureau of Economic Analysis (BEA). Assets totaled $32.16 trillion and liabilities were $46.25 trillion. At the end of the third quarter, the net investment position was –$13.86 trillion.
|
End of 3rd quarter 2020
|
–$13.95 trillion
|
|
End of 2nd quarter 2020
|
–$13.08 trillion
|
The U.S. net international investment position, the difference between U.S. residents’ foreign financial assets and liabilities, was –$13.95 trillion at the end of the third quarter of 2020, according to statistics released by the U.S. Bureau of Economic Analysis (BEA). Assets totaled $29.41 trillion and liabilities were $43.36 trillion. At the end of the second quarter, the net investment position was –$13.08 trillion.