
News Release
U.S. International Investment Position, Second Quarter 2021
The U.S. net international investment position, the difference between U.S. residents’ foreign financial assets and liabilities, was –$15.42 trillion at the end of the second quarter of 2021, according to statistics released by the U.S. Bureau of Economic Analysis (BEA). Assets totaled $34.20 trillion and liabilities were $49.62 trillion.
At the end of the first quarter, the net investment position was –$14.30 trillion (Table 1).
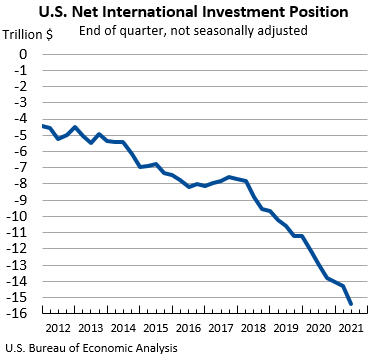

The –$1.12 trillion change in the net investment position from the first quarter to the second quarter came from net financial transactions of –$277.6 billion and net other changes in position, such as price and exchange rate changes, of –$841.4 billion that mostly reflected U.S. stock price increases that exceeded foreign stock price increases (Table A).
Table A. Quarterly Change in the U.S. Net International Investment Position
Billions of dollars, not seasonally adjusted
| End of quarter position, 2021 Q1 |
Change in position in 2021 Q2 | End of quarter position, 2021 Q2 |
|||
| Total | Attributable to: | ||||
| Financial transactions |
Other changes in position 1 |
||||
| U.S. net international investment position | -14,300.5 | -1,119.1 | -277.6 | -841.4 | -15,419.6 |
| Net position excluding financial derivatives | -14,333.6 | -1,123.8 | -269.0 | -854.8 | -15,457.5 |
| Financial derivatives other than reserves, net | 33.1 | 4.8 | -8.6 | 13.4 | 37.9 |
| U.S. assets | 32,838.0 | 1,358.0 | (2) | (2) | 34,196.0 |
| Assets excluding financial derivatives | 30,679.1 | 1,410.8 | 259.3 | 1,151.4 | 32,089.8 |
| Financial derivatives other than reserves | 2,158.9 | -52.8 | (2) | (2) | 2,106.1 |
| U.S. liabilities | 47,138.5 | 2,477.0 | (2) | (2) | 49,615.6 |
| Liabilities excluding financial derivatives | 45,012.7 | 2,534.6 | 528.3 | 2,006.2 | 47,547.3 |
| Financial derivatives other than reserves | 2,125.8 | -57.5 | (2) | (2) | 2,068.3 |
| 1. Disaggregation of other changes in position into price changes, exchange rate changes, and other changes in volume and valuation is presented for annual statistics released in June each year. 2. Financial transactions and other changes in financial derivatives positions are available on a net basis; they are not separately available for U.S. assets and U.S. liabilities. |
|||||
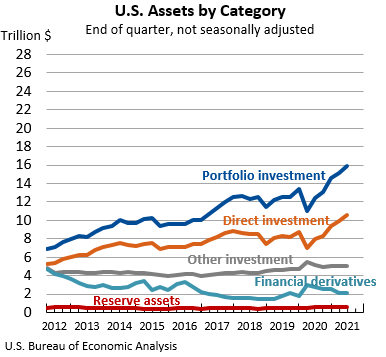
U.S. assets increased by $1.36 trillion, to a total of $34.20 trillion at the end of the second quarter, mostly reflecting increases in portfolio investment and direct investment assets. Portfolio investment assets increased by $755.8 billion, to $15.90 trillion, and direct investment assets increased by $656.4 billion, to $10.55 trillion, driven mainly by increases in foreign stock prices that raised the value of these assets.
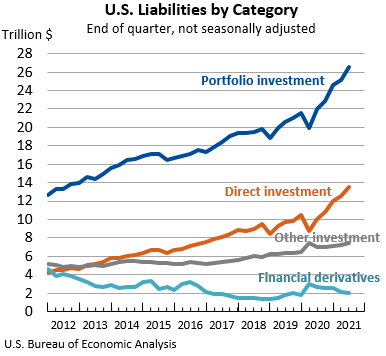
U.S. liabilities increased by $2.48 trillion, to a total of $49.62 trillion at the end of the second quarter, mostly reflecting increases in portfolio investment and direct investment liabilities. Portfolio investment liabilities increased by $1.41 trillion, to $26.59 trillion, and direct investment liabilities increased by $927.2 billion, to $13.49 trillion, driven mainly by increases in U.S. stock prices that raised the value of these liabilities.
|
Updates to First Quarter 2021 International Investment Position Aggregates Trillions of dollars, not seasonally adjusted |
||
| Preliminary estimate | Revised estimate | |
|---|---|---|
| U.S. net international investment position | -14.32 | -14.30 |
| U.S. assets | 32.81 | 32.84 |
| U.S. liabilities | 47.13 | 47.14 |
Upcoming Releases of New Statistics
With the releases of the U.S. international transactions accounts (ITAs) on December 21, 2021, and the international investment position (IIP) accounts on December 30, 2021, BEA will introduce two new ITA tables (ITA tables 4.6 and 6.3) and two new IIP tables (IIP tables 2.2 and 4.1), respectively. These new tables will be released in December to fulfill commitments to the G-20 Data Gaps Initiative and the International Monetary Fund’s Taskforce on Special Purpose Entities for the release of certain new statistics by yearend 2021. ITA table 4.6 will present primary income on foreign direct investment in U.S. resident special purpose entities (SPEs), which are U.S. legal entities with little or no employment or physical presence, and ITA table 6.3 will present financial transactions for direct investment in U.S. resident SPEs. IIP table 2.2 will present direct investment positions in U.S. resident SPEs, and IIP table 4.1 will present U.S. debt positions by currency, sector, and maturity for U.S. assets and liabilities.
In December, these tables will be released as supplemental Excel files to the respective releases. The SPE-related tables—ITA tables 4.6 and 6.3 and IIP table 2.2—will feature annual statistics for 2020, while IIP table 4.1 will feature quarter-end position statistics for the first quarter of 2020 through the third quarter of 2021. In March 2022, these tables will be updated and published as addenda to the current tables in BEA’s interactive data application. In June 2022, the statistics will be updated and incorporated into the standard presentations of the ITAs and the IIP accounts in the interactive data application and in BEA’s data application programming interface. ITA table templates and IIP table templates are provided on BEA’s website to prepare users for the upcoming changes. More information will be available in a preview article of BEA’s annual update of the international economic accounts in the April 2022 issue of the Survey of Current Business.
* * *
Next release: December 30, 2021 at 8:30 A.M. EST
U.S. International Investment Position, Third Quarter 2021
* * *