
News Release
U.S. International Investment Position, First Quarter 2021, Year 2020, and Annual Update
First Quarter 2021
The U.S. net international investment position, the difference between U.S. residents’ foreign financial assets and liabilities, was –$14.32 trillion at the end of the first quarter of 2021, according to statistics released by the U.S. Bureau of Economic Analysis (BEA). Assets totaled $32.81 trillion and liabilities were $47.13 trillion.
At the end of the fourth quarter of 2020, the net investment position was –$14.01 trillion (Table 1).
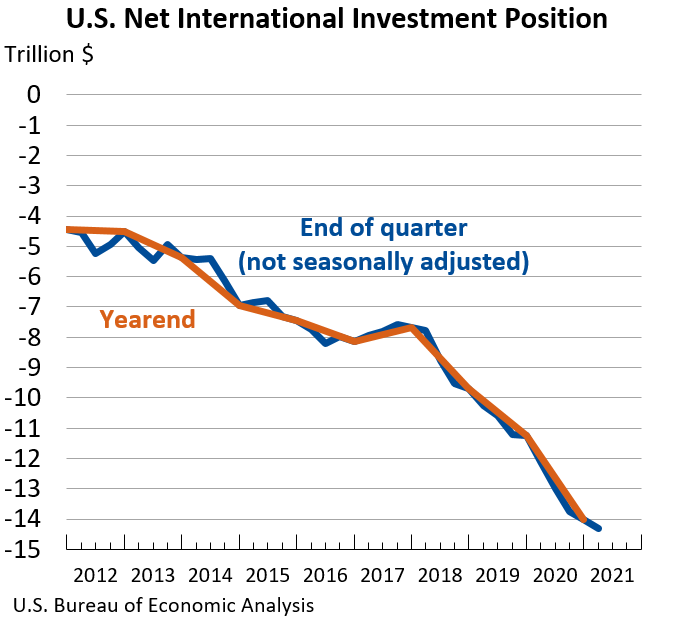

The –$309.0 billion change in the net investment position from the fourth quarter of 2020 to the first quarter of 2021 came from net financial transactions of –$154.4 billion and net other changes in position, such as price and exchange rate changes, of –$154.6 billion (Table A).
Table A. Quarterly Change in the U.S. Net International Investment Position
Billions of dollars, not seasonally adjusted
| End of quarter position, 2020 Q4 |
Change in position in 2021 Q1 | End of quarter position, 2021 Q1 |
|||
| Total | Attributable to: | ||||
| Financial transactions |
Other changes in position 1 |
||||
| U.S. net international investment position | -14,011.2 | -309.0 | -154.4 | -154.6 | -14,320.3 |
| Net position excluding financial derivatives | -14,004.6 | -349.2 | -152.1 | -197.1 | -14,353.8 |
| Financial derivatives other than reserves, net | -6.6 | 40.2 | -2.3 | 42.5 | 33.5 |
| U.S. assets | 32,256.3 | 555.5 | (2) | (2) | 32,811.8 |
| Assets excluding financial derivatives | 29,710.6 | 942.4 | 402.7 | 539.8 | 30,653.0 |
| Financial derivatives other than reserves | 2,545.7 | -386.9 | (2) | (2) | 2,158.8 |
| U.S. liabilities | 46,267.6 | 864.5 | (2) | (2) | 47,132.1 |
| Liabilities excluding financial derivatives | 43,715.2 | 1,291.6 | 554.7 | 736.9 | 45,006.8 |
| Financial derivatives other than reserves | 2,552.4 | -427.1 | (2) | (2) | 2,125.3 |
|
1. Disaggregation of other changes in position into price changes, exchange rate changes, and other changes in volume and valuation is presented for annual statistics (see table B and table 2 in this release). 2. Financial transactions and other changes in financial derivatives positions are available on a net basis; they are not separately available for U.S. assets and U.S. liabilities. |
|||||
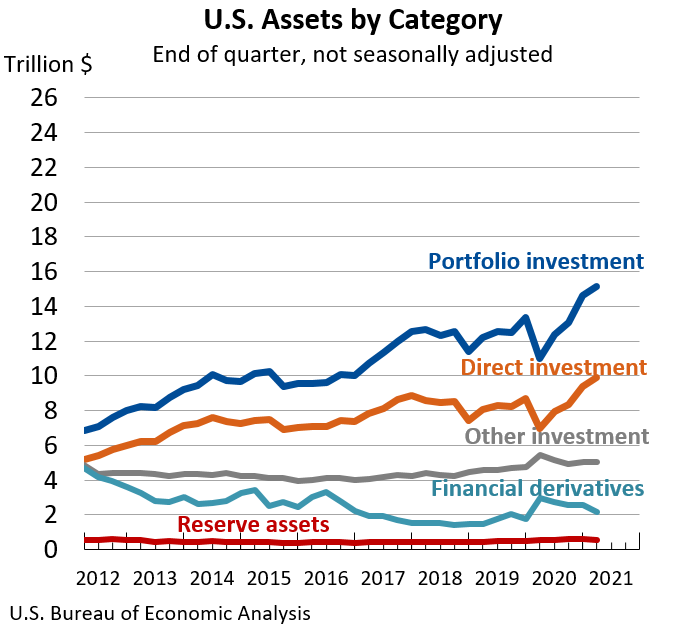
U.S. assets increased by $555.5 billion, to a total of $32.81 trillion at the end of the first quarter, mainly reflecting increases in portfolio investment and direct investment assets that were partly offset by decreases in financial derivatives. Portfolio investment assets increased by $528.3 billion, to $15.13 trillion, driven mainly by foreign stock price increases and strong U.S. net purchases of foreign securities; these increases were partly offset by the depreciation of many major foreign currencies against the U.S. dollar and by foreign bond price decreases. Direct investment assets increased by $484.7 billion, to $9.89 trillion, driven by foreign stock price increases that were partly offset by the depreciation of many major foreign currencies against the U.S. dollar. Financial derivatives decreased by $386.9 billion, to $2.16 trillion, mostly reflecting decreases in single-currency interest rate contracts.
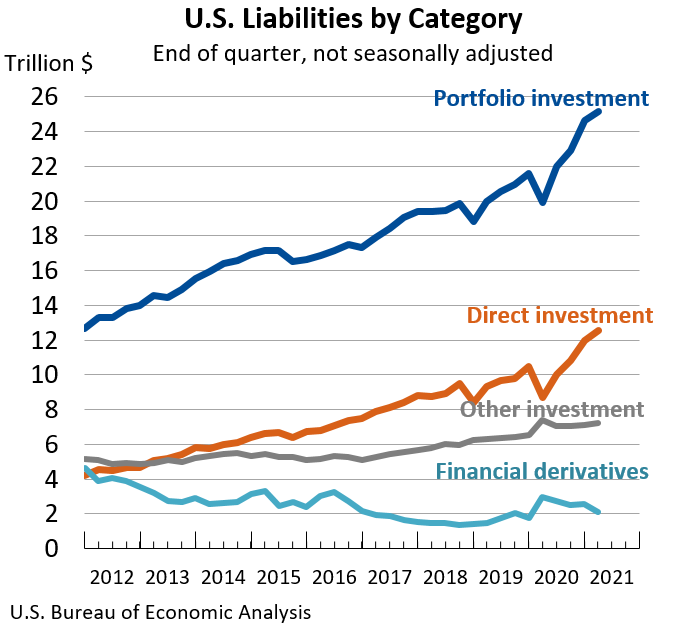
U.S. liabilities increased by $864.5 billion, to a total of $47.13 trillion at the end of the first quarter, mainly reflecting increases in direct investment and portfolio investment liabilities that were partly offset by decreases in financial derivatives. Direct investment liabilities increased by $593.7 billion, to $12.57 trillion, driven by U.S. stock price increases. Portfolio investment liabilities increased by $552.2 billion, to $25.18 trillion, driven by foreign net purchases of U.S. securities and U.S. stock price increases that were partly offset by U.S. bond price decreases. Financial derivatives decreased by $427.1 billion, to $2.13 trillion, mostly reflecting decreases in single-currency interest rate contracts.
Annual Update
The statistics in this release reflect the annual update of the U.S. international investment position (IIP). With this update, BEA has incorporated the results of BEA's 2017 Benchmark Survey of Foreign Direct Investment in the United States, and other newly available and revised source data. Quarterly statistics are revised for the first quarter of 2017 to the fourth quarter of 2020. Annual statistics are revised for 2017–2020.
The results of the benchmark survey impact direct investment assets and liabilities. Newly available and revised source data impact all categories of assets and liabilities, except reserve assets that are unrevised (Table 3).
More information is available in “Preview of the 2021 Annual Update of the International Economic Accounts” in the April 2021 issue of the Survey of Current Business, and additional information will be provided in the July issue. An updated and expanded version of the U.S. International Economic Accounts: Concepts and Methods will be available in July 2021.
Newly Available and Revised Source Data: Key Providers and Years Affected
Annual Update for Year 2020
The U.S. net international investment position was –$14.01 trillion at the end of 2020 compared to –$11.23 trillion at the end of 2019 (Table 2).
The –$2.78 trillion change in the net investment position from the end of 2019 to the end of 2020 came from net financial transactions of –$653.0 billion and net other changes in position, such as price and exchange rate changes, of –$2.13 trillion (Table B).
U.S. assets increased by $3.15 trillion, to a total of $32.26 trillion, at the end of 2020, reflecting increases in all major categories of assets, particularly in portfolio investment, financial derivatives, and direct investment assets. Portfolio investment assets increased by $1.24 trillion, to $14.61 trillion, and direct investment assets increased by $702.9 billion, to $9.41 trillion, driven mainly by the appreciation of major foreign currencies against the U.S. dollar that raised the value of U.S. assets in dollar terms, and to a lesser extent, by financial transactions. Financial derivatives increased by $755.3 billion, to $2.55 trillion, mostly reflecting increases in single-currency interest rate contracts.
U.S. liabilities increased by $5.93 trillion, to a total of $46.27 trillion, at the end of 2020, reflecting increases in all major categories of liabilities, particularly in portfolio investment, direct investment, and financial derivatives liabilities. Portfolio investment liabilities increased by $3.06 trillion, to $24.63 trillion, and direct investment liabilities increased by $1.49 trillion, to $11.98 trillion, driven mainly by U.S. stock price increases and, to a lesser extent, financial transactions. Financial derivatives increased by $782.1 billion, to $2.55 trillion, mostly reflecting increases in single-currency interest rate contracts.
Table B. Annual Change in the U.S. Net International Investment Position
Billions of dollars
| Yearend position, 2019 |
Change in position in 2020 | Yearend position, 2020 |
|||||||
| Total | Attributable to: | ||||||||
| Financial transactions |
Other changes in position | ||||||||
| Total | Price changes | Exchange rate changes | Changes in volume and valuation n.i.e |
||||||
| U.S. net investment position | -11,231.4 | -2,779.8 | -653.0 | -2,126.8 | (1) | (1) | (1) | -14,011.2 | |
| Net position excl. derivatives | -11,251.6 | -2,753.0 | -647.2 | -2,105.8 | -3,169.0 | 1,010.1 | 53.1 | -14,004.6 | |
| Financial derivatives, net | 20.2 | -26.8 | -5.8 | -21.0 | (1) | (1) | (1) | -6.6 | |
| U.S. assets | 29,108.3 | 3,148.1 | (2) | (2) | (2) | (2) | (2) | 32,256.3 | |
| Assets excl. derivatives | 27,317.9 | 2,392.8 | 809.3 | 1,583.4 | 345.4 | 1,097.7 | 140.3 | 29,710.6 | |
| Financial derivatives | 1,790.4 | 755.3 | (2) | (2) | (2) | (2) | (2) | 2,545.7 | |
| U.S. liabilities | 40,339.7 | 5,927.9 | (2) | (2) | (2) | (2) | (2) | 46,267.6 | |
| Liabilities excl. derivatives | 38,569.4 | 5,145.8 | 1,456.5 | 3,689.3 | 3,514.5 | 87.7 | 87.1 | 43,715.2 | |
| Financial derivatives | 1,770.3 | 782.1 | (2) | (2) | (2) | (2) | (2) | 2,552.4 | |
| 1. Data are not separately available for price changes, exchange rate changes, and changes in volume and valuation n.i.e. (not included elsewhere). 2. Financial transactions and other changes in financial derivatives positions are available only on a net basis; they are not separately available for U.S. assets and U.S. liabilities. |
|||||||||
* * *
Next release: September 28, 2021, at 8:30 A.M. EDT
U.S. International Investment Position, Second Quarter 2021
* * *