BEA 21-70
Scheduled Date
December 30 08:30:am
Release Title
U.S. International Investment Position, 3rd Quarter 2021

An official website of the United States government
|
End of 2nd quarter 2020:
|
–$13.05 trillion
|
|
End of 1st quarter 2020:
|
–$12.16 trillion
|
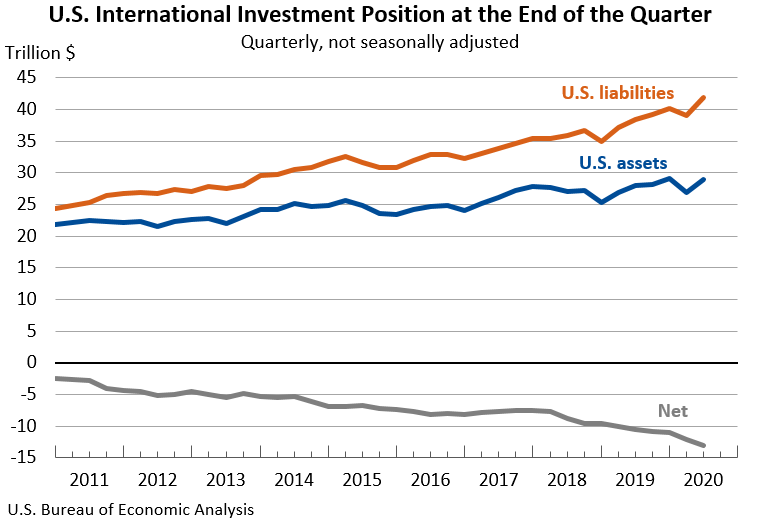
The U.S. net international investment position, the difference between U.S. residents’ foreign financial assets and liabilities, was –$13.05 trillion at the end of the second quarter of 2020, according to statistics released by the U.S. Bureau of Economic Analysis (BEA). Assets totaled $28.87 trillion and liabilities were $41.92 trillion. At the end of the first quarter, the net investment position was –$12.16 trillion.
|
End of 1st quarter 2020:
|
-$12.06 trillion
|
|
End of 4th quarter 2019:
|
-$11.05 trillion
|
|
End of year 2019:
|
-$11.05 trillion
|
|
End of year 2018:
|
-$9.67 trillion
|
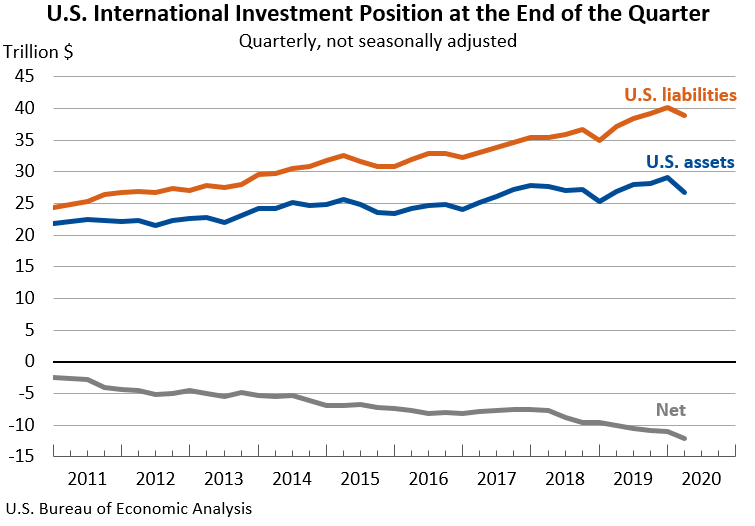
The U.S. net international investment position, the difference between U.S. residents’ foreign financial assets and liabilities, was –$12.06 trillion at the end of the first quarter of 2020, according to statistics released by the U.S. Bureau of Economic Analysis (BEA). Assets totaled $26.77 trillion and liabilities were $38.82 trillion. At the end of the fourth quarter of 2019, the net investment position was –$11.05 trillion.
|
End of 4th quarter 2019:
|
–$10.99 trillion
|
|
End of 3rd quarter 2019:
|
–$10.98 trillion
|
|
End of year 2019:
|
-$10.99 trillion
|
|
End of year 2018:
|
-$9.55 trillion
|
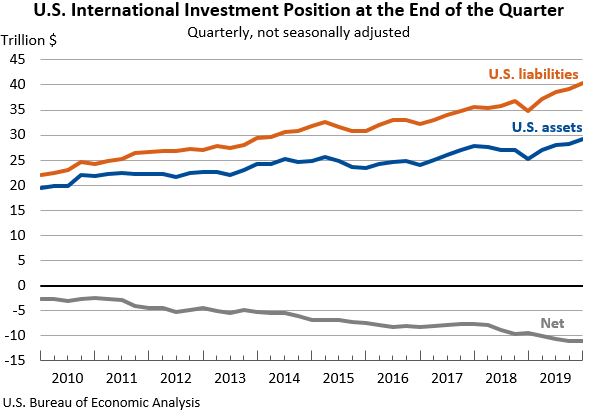
The U.S. net international investment position, the difference between U.S. residents’ foreign financial assets and liabilities, was –$10.99 trillion at the end of the fourth quarter of 2019, according to statistics released by the U.S. Bureau of Economic Analysis (BEA). Assets totaled $29.32 trillion and liabilities were $40.31 trillion. At the end of the third quarter, the net investment position was –$10.98 trillion.
|
End of 3rd quarter 2019:
|
-$10.95 trillion
|
|
End of 2nd quarter 2019:
|
-$10.61 trillion
|
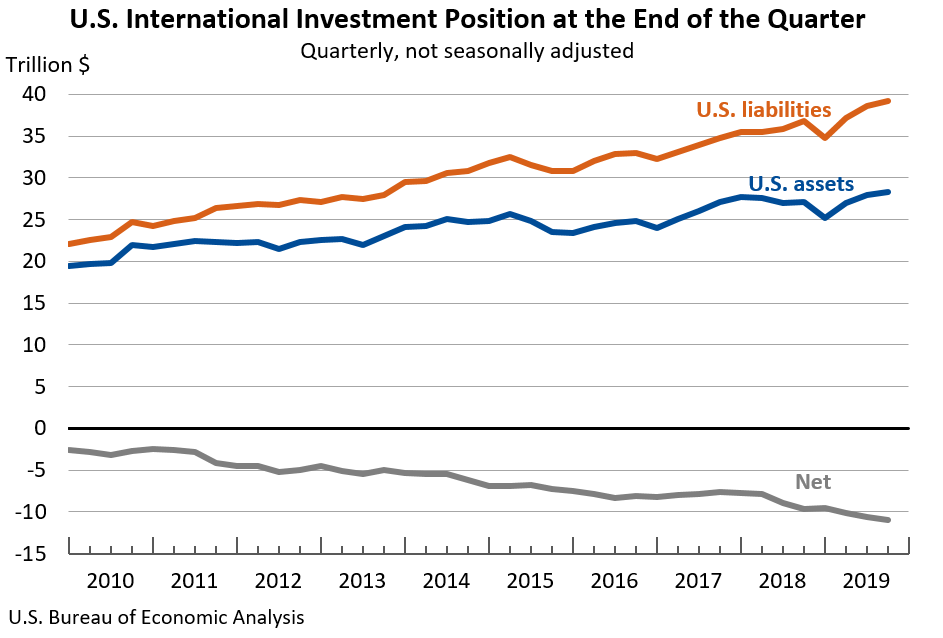
The U.S. net international investment position, the difference between U.S. residents’ foreign financial assets and liabilities, was –$10.95 trillion at the end of the third quarter of 2019, according to statistics released by the U.S. Bureau of Economic Analysis (BEA). Assets totaled $28.26 trillion and liabilities were $39.21 trillion. At the end of the second quarter, the net investment position was –$10.61 trillion.