May 06, 2025

U.S. International Trade in Goods and Services, March 2025

The U.S. monthly international trade deficit increased in March 2025 according to the U.S. Bureau of Economic Analysis and the U.S. Census Bureau. The deficit increased from $123.2 billion in February (revised) to $140.5 billion in March, as imports increased more than exports. The goods deficit increased $16.5 billion in March to $163.5 billion. The services surplus decreased $0.8 billion in March to $23.0 billion.

Principal Federal Economic Indicators

Gross Domestic Product
Q1 2025 (Adv)
-0.3%
Personal Income
March 2025
+0.5%
International Trade in Goods and Services
March 2025
-$140.5 B
International Transactions
Q4 2024
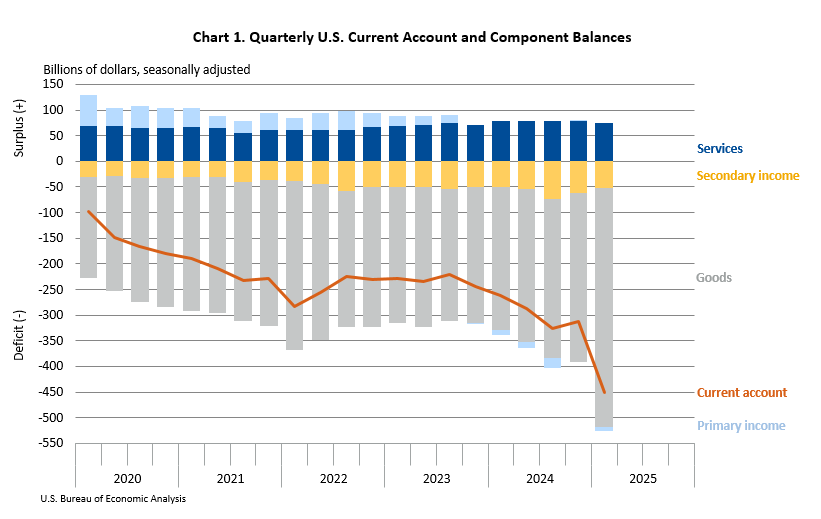
-$303.9 B

Noteworthy

The Latest

Personal Consumption Expenditures by State, 2015

October 4, 2016 | The BEA Wire

Growth in state personal consumption expenditures (PCE) – the measure of goods and services purchased by or on behalf of households – decelerated to 3.6 percent in 2015 from 4.4 percent in 2014. In 2015, growth in PCE was largely concentrated in the Far West and Rocky Mountain regions.

Personal Consumption Expenditures by State, 2015

October 4, 2016 | News Release

Growth in state personal consumption expenditures (PCE) – the measure of goods and services purchased by or on behalf of households – decelerated to 3.6 percent on average in 2015 from 4.4 percent in 2014 (Table 1), according to statistics released today by the Bureau of Economic Analysis. In 2015, PCE growth ranged from 1.5 percent in Wyoming to 5.0 percent in Florida.

Spending on Durable Goods Falls in August

September 30, 2016 | The BEA Wire

Personal income increased 0.2 percent in August after increasing 0.4 percent in July. Wages and salaries, the largest component of personal income, increased 0.1 percent in August after increasing 0.5 percent in July.

Personal Income and Outlays, August 2016

September 30, 2016 | News Release

Personal income increased $39.3 billion (0.2 percent) in August according to estimates released today by the Bureau of Economic Analysis. Disposable personal income (DPI) increased $31.9 billion (0.2 percent) and personal consumption expenditures (PCE) increased $6.2 billion (less than 0.1 percent). Real DPI increased 0.1 percent in August and Real PCE decreased 0.1 percent. The PCE price index increased 0.1 percent.

GDP Increases in Second Quarter

September 29, 2016 | The BEA Wire

Real gross domestic product (GDP) increased 1.4 percent in the second quarter of 2016, according to the “third” estimate released by the Bureau of Economic Analysis. The growth rate was 0.3 percentage point higher than the “second” estimate released in August. In the first quarter, real GDP rose 0.8 percent.

Gross Domestic Product, 2nd quarter 2016 (third estimate); Corporate Profits, 2nd quarter 2016 (revised estimate)

September 29, 2016 | News Release

Real gross domestic product increased at an annual rate of 1.4 percent in the second quarter of 2016 (table 1), according to the "third" estimate released by the Bureau of Economic Analysis. In the first quarter, real GDP increased 0.8 percent. The GDP estimate released today is based on more complete source data than were available for the "second" estimate issued last month. In the second estimate, the increase in real GDP was 1.1 percent.…

Guest blog: Announcing the Open-Source beaR Library

September 28, 2016 | The BEA Wire

This is a guest blog by Justin Antonipillai – Counselor to Secretary Penny Pritzker, with the Delegated Duties of the Under Secretary for Economic Affairs

State Personal Income, Second Quarter 2016

September 28, 2016 | The BEA Wire

State personal income growth accelerated to 1.0 percent on average in the second quarter of 2016 from 0.3 percent in the first quarter. Personal income grew in every state in the second-quarter with growth rates ranging from 0.4 percent in Alaska to 1.4 percent in Utah.

State Quarterly Personal Income, 2nd quarter 2016; State Annual Personal Income, 2015

September 28, 2016 | News Release

State personal income growth accelerated to 1.0 percent on average in the second quarter of 2016 from 0.3 percent in the first quarter, according to estimates released today by the U.S. Bureau of Economic Analysis. Personal income grew in every state in the second-quarter with growth rates ranging from 0.4 percent in Alaska to 1.4 percent in Utah (table 1).

U.S. Net International Investment Position Second Quarter 2016

September 27, 2016 | The BEA Wire

The U.S. net international investment position decreased to −$8,042.8 billion (preliminary) at the end of the second quarter of 2016 from −$7,582.0 billion (revised) at the end of the first quarter.