Bureau of Economic Analysis
Direct Investment by Country and Industry, 2024
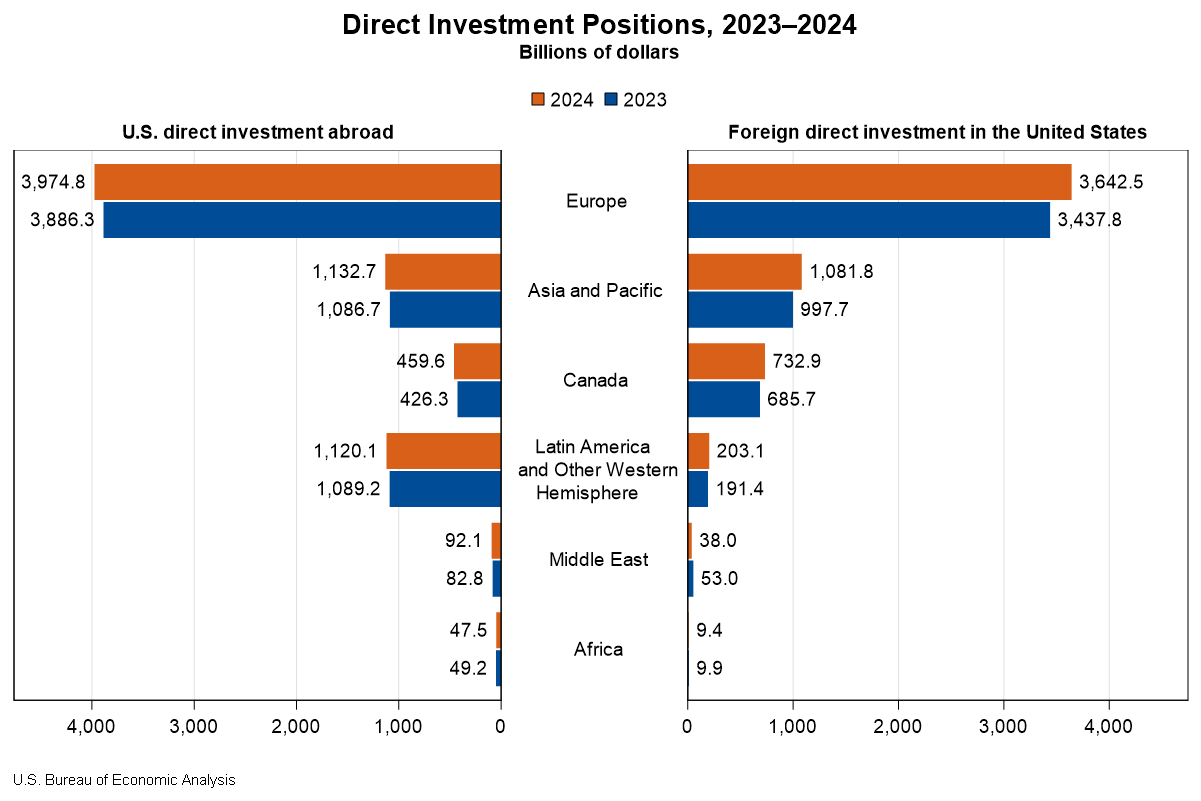
The U.S. direct investment abroad position, or cumulative level of investment, increased $206.3 billion to $6.83 trillion at the end of 2024, according to statistics released today by the U.S. Bureau of Economic Analysis. The increase was led by an $88.4 billion increase in the position in Europe, primarily in Luxembourg and Germany. By industry, manufacturing affiliates had the largest increase, led by manufacturing of computers and electronic products.
The foreign direct investment in the United States position increased $332.1 billion to $5.71 trillion at the end of 2024. The increase was led by a $204.7 billion increase in the position from Europe, which reflected a $52.9 billion increase from the United Kingdom and a $39.7 billion increase from Germany. By industry, affiliates in manufacturing increased the most.
Principal Federal Economic Indicators
Noteworthy
- 2025 News Release Schedule
- Innovation at BEA
- 2025 Annual Updates
- New! Services Trade Data for More Countries
- Data Tool: Trade in Value Added
- Distribution of State Personal Income
- Updated: RIMS II Regional Multipliers
- Arts and Culture
- Space Economy
- FDI Now in State BEARFACTS
- Quick Guide: Price Indexes
The Latest
Gross Domestic Product, 1st quarter 2014 (advance estimate)
Real gross domestic product -- the output of goods and services produced by labor and property located in the United States -- increased at an annual rate of 0.1 percent in the first quarter (that is, from the fourth quarter of 2013 to the first quarter of 2014), according to the "advance" estimate released by the Bureau of Economic Analysis.
New Quarterly Statistics Detail Industries' Economic Performance
The Bureau of Economic Analysis released today – for the first time – gross domestic product (GDP) by industry for 22 industry sectors on a quarterly basis. These new statistics fill an important gap in U.S. federal economic statistics by providing timely information on how individual industries contributed to U.S. economic growth in a given quarter.
New Commerce Data Supports Better Economic Decision-Making by Businesses and Policymakers
This week, the Commerce Department’s Bureau of Economic Analysis (BEA) released two new data products that will help American businesses, consumers, policymakers and academia gain important information about the performance of the U.S. economy.
New BEA Data Proves Valuable for Retail Industry
Guest blog post by Jack Kleinhenz, Ph.D., Chief Economist, National Retail Federation
NRF is the world’s largest retail trade association, representing discount and department stores, home goods and specialty stores, Main Street merchants, grocers, wholesalers, chain restaurants and Internet retailers from the United States and more than 45 countries.
Gross Domestic Product by Industry, 4th quarter and annual 2013
The Bureau of Economic Analysis released today – for the first time – gross domestic product (GDP) by industry for 22 industry sectors on a quarterly basis. These new statistics fill an important gap in U.S. federal economic statistics by providing timely information on how individual industries contributed to U.S. economic growth in a given quarter. These new data also provide businesses with a comprehensive and consistent tool for…
BEA Introduces New Measures of the Regional Economy—Estimates of Real Personal Income for States, 2008–2012
Today, the U.S. Bureau of Economic Analysis released real, price-adjusted estimates of personal income for states and metropolitan areas for 2008-2012. The price-adjustments are based on regional price parities (RPPs) and on BEA’s national Personal Consumption Expenditure (PCE) price index. The RPPs measure geographic differences in the price levels of consumption goods and services relative to the national average, and the PCE…
BEA Introduces New Measures of the Regional Economy—Estimates of Real Personal Income for Metropolitan Areas, 2008–2012
Today, the U.S. Bureau of Economic Analysis released real, price-adjusted estimates of personal income for states and metropolitan areas for 2008-2012. The price-adjustments are based on regional price parities (RPPs) and on BEA’s national Personal Consumption Expenditure (PCE) price index. The RPPs measure geographic differences in the price levels of consumption goods and services relative to the national average, and the PCE…
Real Personal Income for States and Metropolitan Areas, 2008-2012
Today, the U.S. Bureau of Economic Analysis released real, price-adjusted estimates of personal income for states and metropolitan areas for 2008-2012.
Coming Soon: New Statistics Will Provide More Timely Snapshot of How Industries are Performing
Want to know how much manufacturing contributed to U.S. economic growth in a given quarter? How about educational services?
For the first time, the Bureau of Economic Analysis (BEA) will soon start producing on a regular basis quarterly estimates of economic activity generated by 22 industries.
Coming Soon: Real Personal Income Statistics for States and Metropolitan Areas
The Bureau of Economic Analysis will soon release real personal income statistics using regional price indexes to adjust BEA’s personal income data for differences in the cost of living across states and metro areas. These new statistics will inform decisions by businesses and households alike – from deciding where to move for a new job or locating a new company to helping economic development offices shape regional marketing plans and…


