June 30, 2025

U.S. International Investment Position, 1st Quarter 2025 and Annual Update

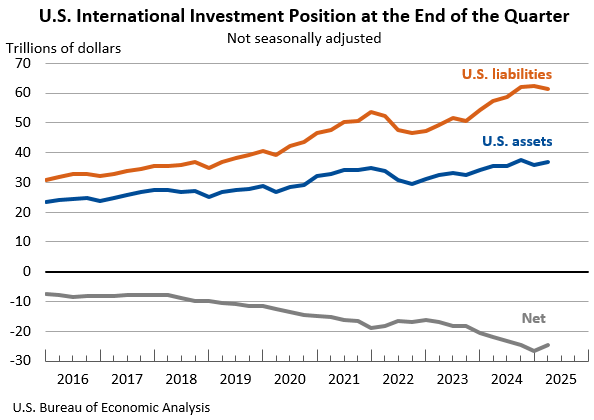
The U.S. net international investment position, the difference between U.S. residents’ foreign financial assets and liabilities, was -$24.61 trillion at the end of the first quarter of 2025, according to statistics released today by the U.S. Bureau of Economic Analysis. Assets totaled $36.85 trillion, and liabilities were $61.47 trillion. At the end of the fourth quarter of 2024, the net investment position was -$26.54 trillion (revised).
Principal Federal Economic Indicators

Gross Domestic Product
Q1 2025 (3rd)
-0.5%
Personal Income
May 2025
-0.4%
International Trade in Goods and Services
April 2025
-$61.6 B
International Transactions
Q1 2025
-$450.2 B

Noteworthy

The Latest

BEA Director Steve Landefeld to Retire

March 24, 2014 | The BEA Wire

Steve Landefeld, Director of the U.S. Bureau of Economic Analysis, plans to retire in early May. Dr. Landefeld took the helm in May 1995 and in his 19 years as director was instrumental in implementing major changes aimed at better measuring the dynamic U.S. and world economies.

Under Dr. Landefeld’s leadership, the non-partisan BEA:

Travel and Tourism Spending Accelerated in the Fourth Quarter of 2013

March 20, 2014 | The BEA Wire

Real spending on travel and tourism accelerated in the fourth quarter of 2013, increasing at an annual rate of 4.2 percent after increasing 3.1 percent (revised) in the third quarter of 2013.

Travel and Tourism Satellite Accounts, 4th quarter 2013

March 20, 2014 | News Release

TRAVEL AND TOURISM SPENDING ACCELERATED IN THE FOURTH QUARTER OF 2013

U.S. Current-Account Deficit Decreases in Fourth Quarter 2013

March 19, 2014 | The BEA Wire

The U.S. current-account deficit—the combined balances on trade in goods and services, income, and net unilateral current transfers—decreased to $81.1 billion (preliminary) in the fourth quarter of 2013 from $96.4 billion (revised) in the third quarter of 2013. As a percentage of U.S. GDP, the deficit decreased to 1.9 percent from 2.3 percent. The previously published current-account deficit for the third quarter was $94.8 billion.

Attention BEA Data Hounds: Our Interactive Tables Look a Little Different, But They Function the Same Way

March 13, 2014 | The BEA Wire

Eagle-eyed folks using our interactive data tables have probably noticed they look a tad different.

Despite some differences in the way they look, BEA’s interactive data tables operate in the same way.

The changes are part of a BEA upgrade to the next generation of language used to create Web pages, called HTML5. This upgrade will make it easier for BEA to develop applications that are more robust and design Web…

New Statistics Will Provide More Timely Snapshot of How Industries are Performing

March 10, 2014 | The BEA Wire

Want to know how much manufacturing contributed to U.S. economic growth in a given quarter? How about educational services?

For the first time, the Bureau of Economic Analysis (BEA) will soon start producing on a regular basis quarterly estimates of economic activity generated by 22 industries.

January 2014 Trade Gap is $39.1 Billion

March 7, 2014 | The BEA Wire

The U.S. monthly international trade deficit increased in January 2014 according to the U.S. Bureau of Economic Analysis and the U.S. Census Bureau. The deficit increased from $39.0 billion in December (revised) to $39.1 billion in January as imports increased more than exports. The previously published December deficit was $38.7 billion. The goods deficit increased $0.7 billion from December to $59.3 billion in January; the services surplus…

U.S. International Trade in Goods and Services, January 2014

March 7, 2014 | News Release

U.S. Census Bureau U.S. Bureau of Economic Analysis NEWS U.S. Department of Commerce * Washington, DC 20230 U.S. INTERNATIONAL TRADE IN GOODS AND SERVICES January 2014 Goods and Services The U.S. Census Bureau and the U.S.

Real Consumer Spending Rises in January

March 3, 2014 | The BEA Wire

Personal income increased 0.3 percent in January after remaining flat in December, in part reflecting increases in Medicaid and other government social benefits due to the Affordable Care Act (ACA). Excluding all special factors, personal income rose 0.2 percent in January, following a decrease of 0.1 percent in December.

Current-dollar disposable personal income (DPI), after-tax income, increased 0.4 percent in January after…