Bureau of Economic Analysis
Personal Income and Outlays, July 2025
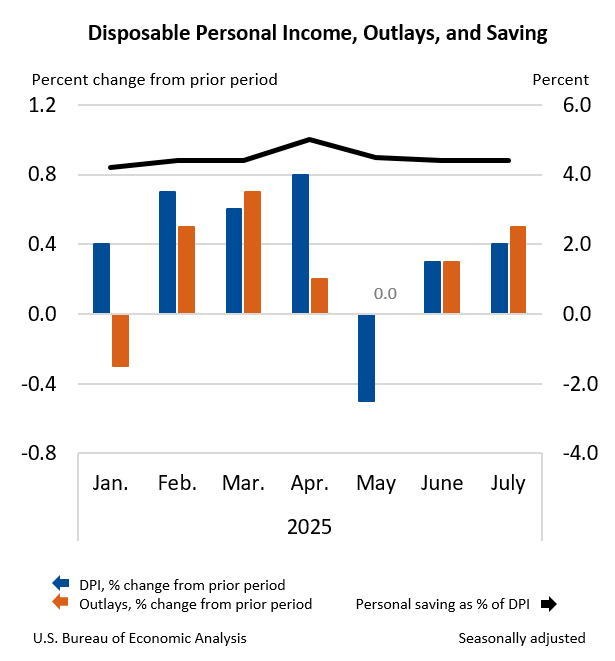
Personal income increased $112.3 billion (0.4 percent at a monthly rate) in July, according to estimates released today by the U.S. Bureau of Economic Analysis. Disposable personal income (DPI)—personal income less personal current taxes—increased $93.9 billion (0.4 percent) and personal consumption expenditures (PCE) increased $108.9 billion (0.5 percent). Personal outlays—the sum of PCE, personal interest payments, and personal current transfer payments—increased $110.9 billion in July. Personal saving was $985.6 billion in July and the personal saving rate—personal saving as a percentage of disposable personal income—was 4.4 percent.
Principal Federal Economic Indicators
Noteworthy
- 2025 News Release Schedule
- Innovation at BEA
- 2025 Annual Updates
- Distribution of Personal Income Nowcast
- New! Services Trade Data for More Countries
- Data Tool: Trade in Value Added
- Updated: RIMS II Regional Multipliers
- Arts and Culture
- Space Economy
- FDI Now in State BEARFACTS
- Quick Guide: Price Indexes
The Latest
Gross Domestic Product by Industry: Second Quarter 2016 Annual Update: 2013 through First Quarter 2016
Transportation and warehousing; health care and social assistance; and professional, scientific, and technical services were the leading contributors to the increase in U.S. economic growth in the second quarter of 2016. Overall, 15 of 22 industry groups contributed to the 1.4 percent increase in real GDP in the second quarter.
Gross Domestic Product by Industry, 2nd quarter 2016
Transportation and warehousing; health care and social assistance; and professional, scientific, and technical services were the leading contributors to the increase in U.S. economic growth in the second quarter of 2016. According to gross domestic product (GDP) by industry statistics released by the Bureau of Economic Analysis, 15 of 22 industry groups contributed to the overall 1.4 percent increase in real GDP in the second quarter.
BEA Releases New Batch of Health Care Statistics
The Bureau of Economic Analysis released a fresh set of statistics Wednesday detailing how much the United States spends to treat different diseases and medical conditions.
The numbers, which cover 2013, offer new insights into health care, which accounts for more than 17 percent of the U.S. economy.
Consumer Spending Rises in September
Personal income increased 0.3 percent in September after increasing 0.2 percent in August. Wages and salaries, the largest component of personal income, increased 0.3 percent in September after increasing 0.1 percent in August.
Personal Income and Outlays, September 2016
Personal income increased $46.7 billion (0.3 percent) in September according to estimates released today by the Bureau of Economic Analysis. Disposable personal income (DPI) increased $37.0 billion (0.3 percent) and personal consumption expenditures (PCE) increased $61.0 billion (0.5 percent). Real DPI increased less than 0.1 percent in September and Real PCE increased 0.3 percent. The PCE price index increased 0.2 percent.
GDP Increases in Third Quarter
Real gross domestic product (GDP) increased 2.9 percent in the third quarter of 2016, according to the “advance” estimate released by the Bureau of Economic Analysis. In the second quarter, real GDP rose 1.4 percent.
Gross Domestic Product, 3rd quarter 2016 (advance estimate)
Real gross domestic product increased at an annual rate of 2.9 percent in the third quarter of 2016 (table 1), according to the "advance" estimate released by the Bureau of Economic Analysis. In the second quarter, real GDP increased 1.4 percent. The Bureau emphasized that the third-quarter advance estimate released today is based on source data that are incomplete or subject to further revision by the source agency (see “Source Data for the…
Learn How BEA's Regional Statistics are Used to Distribute Federal Funds to State and Local Governments
Did you know that each year BEA regional economic statistics, such as annual personal income and per capita personal income are used to allocate billions of dollars in federal funds to states and local governments? In fiscal year 2015, nearly $400 billion in federal funds were distributed under programs using BEA statistics in federal funding formulas.
Expanded Geographic Detail on International Trade in Services Coming Soon
How much do U.S. residents spend on travel to Greece? How much does the U.S. export in movies and television programming to Vietnam? You can answer these questions next week when the Bureau of Economic Analysis expands the geographic detail it publishes on U.S. imports and exports of services. On October 24, we will publish annual statistics on international trade in services with 90 countries and areas, up from 49.
County GDP Stats Would Give a Closer Look at Local Economies
Anyone interested in economic growth in, let’s say, West Virginia can check state GDP data from the U.S. Bureau of Economic Analysis. Want to zoom in on a metro area, such as Charleston, W.Va., and its surroundings? BEA has gross domestic product by metropolitan areas, too.


