Bureau of Economic Analysis
U.S. International Trade in Goods and Services, July 2025
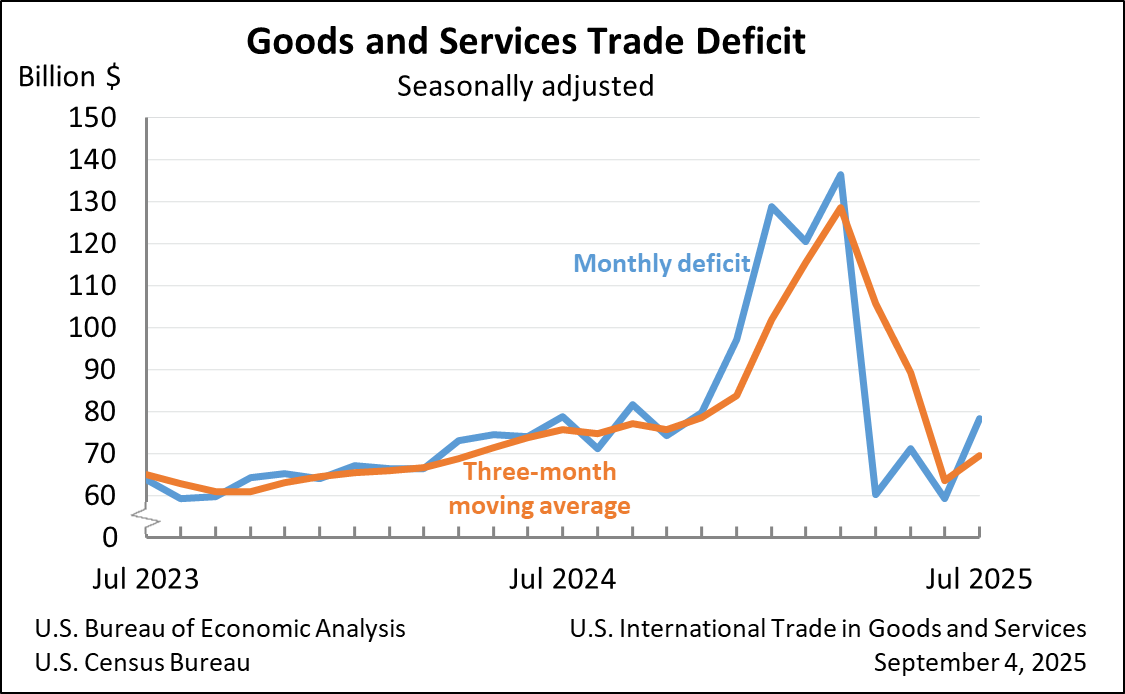
The U.S. goods and services trade deficit increased in July 2025 according to the U.S. Bureau of Economic Analysis and the U.S. Census Bureau. The deficit increased from $59.1 billion in June (revised) to $78.3 billion in July, as imports increased more than exports. The goods deficit increased $18.2 billion in July to $103.9 billion. The services surplus decreased $1.1 billion in July to $25.6 billion.
Principal Federal Economic Indicators
Noteworthy
The Latest
U.S. Current-Account Deficit Increases in First Quarter 2014
The U.S. current-account deficit—a net measure of transactions between the United States and the rest of the world in goods, services, primary income (investment income and compensation), and secondary income (current transfers)—increased to $111.2 billion (preliminary) in the first quarter of 2014 from $87.3 billion (revised) in the fourth quarter of 2013. As a percent of current-dollar GDP, the deficit increased to 2.6 percent from 2.0…
International Statistical Update: Health- and Education-Related Travel Now Part of Travel Services
You may have noticed some data on international travel services look a little bit different. With the release of the monthly trade report on June 4, spending on health- and education-related travel are now counted in the travel services category. Previously, both were included in a category called “other personal services.”
Attention Developers: More Economic Statistics Added to BEA's API
Developers, do you want to bring more detailed economic data to your next app? The Bureau of Economic Analysis (BEA) recently added several data sets to the application programming interface (API) we launched last year.
The API now provides direct access to the gross domestic product (GDP) underlying detail tables. Those tables contain a wealth of statistics, including how much consumers spend on hundreds of items like furnishings,…
Advance GDP by State Statistics: Widespread But Slower Growth in 2013
Real GDP increased in 49 states in 2013. Leading industry contributors were nondurable-goods manufacturing; real estate and rental and leasing; and agriculture, forestry, fishing, and hunting. Nondurable-goods manufacturing was the largest contributor to U.S. real GDP by state growth in 2013.
Gross Domestic Product by State, 2013 (advance estimate) and 1997-2012 (revised estimates)
Advance 2013 and Revised 1997—2012 Statistics of GDP by State
Real gross domestic product (GDP) increased in 49 states in 2013, according to new statistics released today by the Bureau of Economic Analysis (BEA).1 Nondurable–goods manufacturing; real estate and rental and leasing; and agriculture, forestry, fishing, and hunting were the leading contributors to real U.S. economic growth. U.S. real GDP growth slowed to 1.8 percent in 2013…
April 2014 Trade Gap is $47.2 Billion
With this release, statistics on trade in goods and services for January 1999 to March 2014 are revised to reflect newly available and revised source data, changes in estimation methods, and changes in definitions and classifications. For more information see www.bea.gov/international/revision-2014.htm.
U.S. International Trade in Goods and Services, April 2014
NOTE: See the navigation bar at the right side of the news release text for a link to an important note about revisions to goods and services and the comprehensive restructuring of the International Economic Accounts. Also see links to data tables, contact personnel and their telephone numbers, and supplementary materials.
-->
Real Consumer Spending Falls in April
Personal income increased 0.3 percent in April after increasing 0.5 percent in March. Wages and salaries, the largest component of personal income, increased 0.2 percent after increasing 0.6 percent.
Current-dollar disposable personal income (DPI), after-tax income, increased 0.3 percent in April after increasing 0.5 percent in March.
Real DPI, income adjusted for taxes and inflation, increased 0.2 percent in April…
Personal Income and Outlays, April 2014
Personal income increased $43.7 billion, or 0.3 percent, and disposable personal income (DPI) increased $44.6 billion, or 0.3 percent, in April, according to the Bureau of Economic Analysis. Personal consumption expenditures (PCE) decreased $8.1 billion, or 0.1 percent. In March, personal income increased $76.3 billion, or 0.5 percent, DPI increased $65.0 billion, or 0.5 percent, and PCE increased $117.6 billion, or 1.0 percent, based on…


