June 30, 2025

U.S. International Investment Position, 1st Quarter 2025 and Annual Update

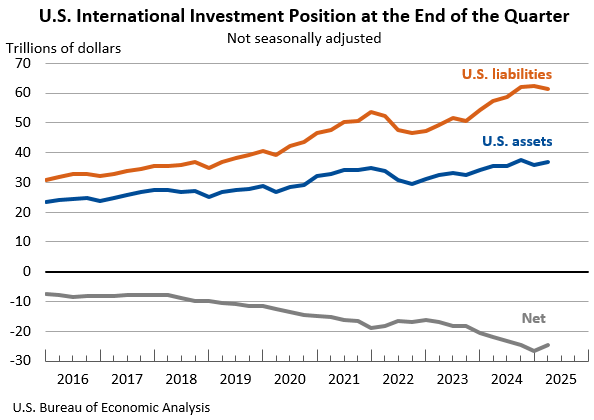
The U.S. net international investment position, the difference between U.S. residents’ foreign financial assets and liabilities, was -$24.61 trillion at the end of the first quarter of 2025, according to statistics released today by the U.S. Bureau of Economic Analysis. Assets totaled $36.85 trillion, and liabilities were $61.47 trillion. At the end of the fourth quarter of 2024, the net investment position was -$26.54 trillion (revised).
Principal Federal Economic Indicators

Gross Domestic Product
Q1 2025 (3rd)
-0.5%
Personal Income
May 2025
-0.4%
International Trade in Goods and Services
April 2025
-$61.6 B
International Transactions
Q1 2025
-$450.2 B

Noteworthy

The Latest

U.S. International Trade in Goods and Services, March 2019

May 9, 2019 | News Release

The U.S. monthly international trade deficit increased in March 2019 according to the U.S. Bureau of Economic Analysis and the U.S. Census Bureau. The deficit increased from $49.3 billion in February (revised) to $50.0 billion in March, as imports increased more than exports. The previously published February deficit was $49.4 billion. The goods deficit increased $0.5 billion in March to $72.4 billion. The services surplus decreased $0.2 billion…

Gross Domestic Product by State, Fourth Quarter 2018

May 1, 2019 | The BEA Wire

Real gross domestic product (GDP) increased in 49 states and the District of Columbia in the fourth quarter of 2018.  The percent change in real GDP in the fourth quarter ranged from 6.6 percent in Texas to 0.0 percent in Delaware. Wholesale trade, mining, and information services were the leading contributors to the increase in real GDP nationally. Mining and wholesale trade were the leading contributors to the increase in real GDP in Texas…

Gross Domestic Product by State: Fourth Quarter and Annual 2018

May 1, 2019 | News Release

Real gross domestic product (GDP) increased in 49 states and the District of Columbia in the fourth quarter of 2018. The percent change in real GDP in the fourth quarter ranged from 6.6 percent in Texas to 0.0 percent in Delaware.

Real Consumer Spending Rises In March

April 29, 2019 | The BEA Wire

Personal income increased 0.1 percent in March after increasing 0.2 percent in February. Wages and salaries, the largest component of personal income, increased 0.4 percent in March after increasing 0.3 percent in February.

Personal Income and Outlays, March 2019

April 29, 2019 | News Release

Personal income increased 0.1 percent in March after increasing 0.2 percent in February. Wages and salaries, the largest component of personal income, increased 0.4 percent in March after increasing 0.3 percent in February.

GDP Increases in First Quarter

April 26, 2019 | The BEA Wire

Real gross domestic product increased 3.2 percent in the first quarter of 2019, according to the “advance” estimate released by the Bureau of Economic Analysis. In the fourth quarter of 2018, real GDP increased 2.2 percent.

Gross Domestic Product, First Quarter 2019 (Advance Estimate)

April 26, 2019 | News Release

Real gross domestic product (GDP) increased 3.2 percent in the first quarter of 2019, according to the “advance” estimate released by the Bureau of Economic Analysis. In the fourth quarter of 2018, real GDP increased 2.2 percent.

Gross Domestic Product by Industry: Fourth Quarter 2018

April 19, 2019 | The BEA Wire

Wholesale trade; mining; and information were the leading contributors to the increase in U.S. economic growth in the fourth quarter of 2018. Overall, 15 of 22 industry groups contributed to the 2.2 percent increase in real GDP in the fourth quarter.

Gross Domestic Product by Industry: Fourth Quarter and Annual 2018

April 19, 2019 | News Release

Wholesale trade; mining; and information were the leading contributors to the increase in U.S. economic growth in the fourth quarter of 2018. Overall, 15 of 22 industry groups contributed to the 2.2 percent increase in real GDP in the fourth quarter.

February 2019 Trade Gap is $49.4 Billion

April 17, 2019 | The BEA Wire

The U.S. monthly international trade deficit decreased in February 2019 according to the U.S. Bureau of Economic Analysis and the U.S. Census Bureau. The deficit decreased from $51.1 billion in January (revised) to $49.4 billion in February, as exports increased more than imports. The previously published January deficit was $51.1 billion. The goods deficit decreased $1.2 billion in February to $72.0 billion. The services surplus increased $0…