June 26, 2025
Gross Domestic Product, 1st Quarter 2025 (Third Estimate), GDP by Industry, and Corporate Profits (Revised)
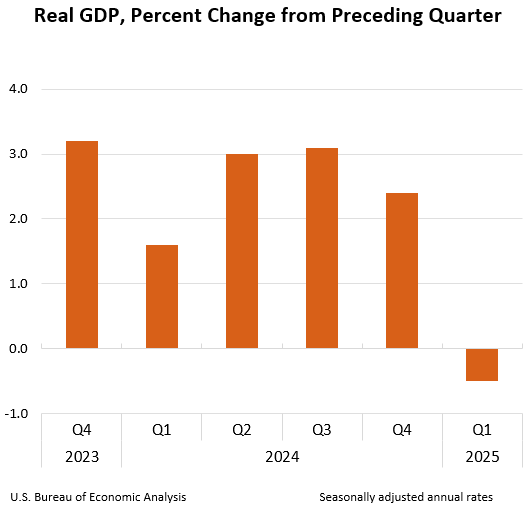
Real gross domestic product (GDP) decreased at an annual rate of 0.5 percent in the first quarter of 2025 (January, February, and March), according to the third estimate released by the U.S. Bureau of Economic Analysis. In the fourth quarter of 2024, real GDP increased 2.4 percent. The decrease in real GDP in the first quarter primarily reflected an increase in imports, which are a subtraction in the calculation of GDP, and a decrease in government spending. These movements were partly offset by increases in investment and consumer spending.