
Bureau of Economic Analysis
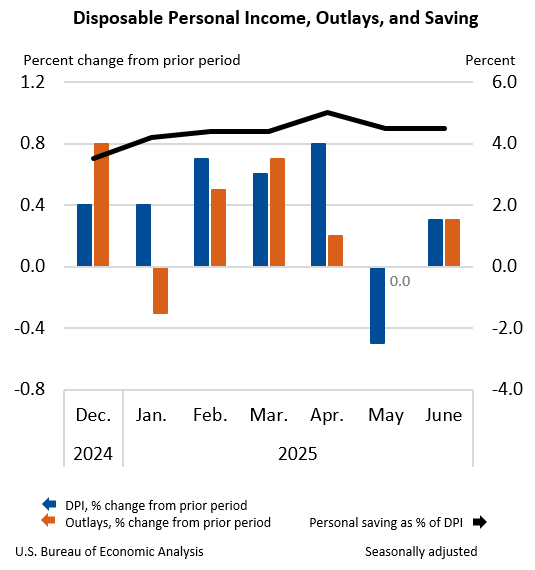
Personal Income and Outlays, June 2025
Personal income increased $71.4 billion (0.3 percent at a monthly rate) in June, according to estimates released today by the U.S. Bureau of Economic Analysis. Disposable personal income (DPI)—personal income less personal current taxes—increased $61.0 billion (0.3 percent) and personal consumption expenditures (PCE) increased $69.9 billion (0.3 percent). Personal outlays—the sum of PCE, personal interest payments, and personal current transfer payments—increased $69.5 billion in June. Personal saving was $1.01 trillion in June and the personal saving rate—personal saving as a percentage of disposable personal income—was 4.5 percent.
Principal Federal Economic Indicators
Noteworthy
- 2025 News Release Schedule
- Innovation at BEA
- 2025 Annual Updates
- New! Services Trade Data for More Countries
- Data Tool: Trade in Value Added
- Distribution of State Personal Income
- Updated: RIMS II Regional Multipliers
- Arts and Culture
- Space Economy
- FDI Now in State BEARFACTS
- Quick Guide: Price Indexes


The Latest
U.S. International Trade in Goods and Services, August 2022
The U.S. monthly international trade deficit decreased in August 2022 according to the U.S. Bureau of Economic Analysis and the U.S. Census Bureau. The deficit decreased from $70.5 billion in July (revised) to $67.4 billion in August, as imports decreased more than exports. The previously published July deficit was $70.6 billion. The goods deficit decreased $3.4 billion in August to $87.6 billion. The services surplus decreased $0.4 billion in…
Gross Domestic Product by State and Personal Income by State, 2nd Quarter 2022
Real gross domestic product (GDP) decreased in 40 states and the District of Columbia in the second quarter of 2022, with the percent change in real GDP ranging from 1.8 percent in Texas to –4.8 percent in Wyoming.
In the second quarter of 2022, as real GDP for the nation decreased at an annual rate of 0.6 percent, real GDP decreased in 8 of the 23 industry groups for which BEA prepares quarterly state estimates. Construction;…
Gross Domestic Product by State and Personal Income by State, 2nd Quarter 2022
Real gross domestic product (GDP) decreased in 40 states and the District of Columbia in the second quarter of 2022, with the percent change in real GDP ranging from 1.8 percent in Texas to –4.8 percent in Wyoming.
Personal Income and Outlays, August 2022 and Annual Update
Personal income increased $71.6 billion, or 0.3 percent at a monthly rate, while consumer spending increased $67.5 billion, or 0.4 percent, in August. The increase in personal income primarily reflected increases in compensation and proprietors’ income. The personal saving rate (that is, personal saving as a percentage of disposable personal income) was 3.5 percent in August, the same rate as in July.
Gross Domestic Product (Third Estimate), Corporate Profits (Revised Estimate), and GDP by Industry, Second Quarter 2022 and Annual Update
Real gross domestic product (GDP) decreased at an annual rate of 0.6 percent in the second quarter of 2022, following a decrease of 1.6 percent in the first quarter. The second-quarter decrease was the same as previously estimated in the “second” estimate released in August. The smaller decrease in the second quarter, compared to the first quarter, reflected an upturn in exports and an acceleration in consumer spending. For more details,…
Gross Domestic Product (Third Estimate), GDP by Industry, and Corporate Profits (Revised), 2nd Quarter 2022 and Annual Update
Real gross domestic product (GDP) decreased at an annual rate of 0.6 percent in the second quarter of 2022, following a decrease of 1.6 percent in the first quarter. The second-quarter decrease was the same as previously estimated in the “second” estimate released in August. The smaller decrease in the second quarter, compared to the first quarter, reflected an upturn in exports and an acceleration in consumer spending. Profits increased 4.6…
U.S. International Investment Position, 2nd Quarter 2022
The U.S. net international investment position, the difference between U.S. residents’ foreign financial assets and liabilities, was –$16.31 trillion at the end of the second quarter of 2022, according to statistics released today by the U.S. Bureau of Economic Analysis (BEA). Assets totaled $30.98 trillion, and liabilities were $47.29 trillion. At the end of the first quarter, the net investment position was –$17.75 trillion.
U.S. International Investment Position, 2nd Quarter 2022
The U.S. net international investment position (IIP), the difference between U.S. residents’ foreign financial assets and liabilities, was -$16.31 trillion at the end of the second quarter of 2022, according to statistics released today by the U.S. Bureau of Economic Analysis (BEA). Assets totaled $30.98 trillion, and liabilities were $47.29 trillion. At the end of the first quarter, the net investment position was -$17.75 trillion.
U.S. International Transactions, 2nd Quarter 2022
The U.S. current-account deficit narrowed by $31.5 billion, or 11.1 percent, to $251.1 billion in the second quarter of 2022, according to statistics released today by the U.S. Bureau of Economic Analysis. The revised first-quarter deficit was $282.5 billion. The second-quarter deficit was 4.0 percent of current-dollar gross domestic product, down from 4.6 percent in the first quarter.