June 30, 2025

U.S. International Investment Position, 1st Quarter 2025 and Annual Update

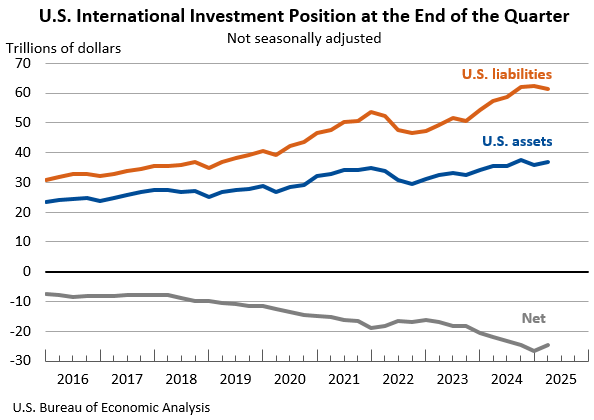
The U.S. net international investment position, the difference between U.S. residents’ foreign financial assets and liabilities, was -$24.61 trillion at the end of the first quarter of 2025, according to statistics released today by the U.S. Bureau of Economic Analysis. Assets totaled $36.85 trillion, and liabilities were $61.47 trillion. At the end of the fourth quarter of 2024, the net investment position was -$26.54 trillion (revised).

Principal Federal Economic Indicators

Gross Domestic Product
Q1 2025 (3rd)
-0.5%
Personal Income
May 2025
-0.4%
International Trade in Goods and Services
April 2025
-$61.6 B
International Transactions
Q1 2025
-$450.2 B

Noteworthy

The Latest

Gross Domestic Product by Metropolitan Area, 2016

September 20, 2017 | News Release

Real gross domestic product (GDP) increased in 267 out of 382 metropolitan areas in 2016 according to statistics on the geographic breakout of GDP released by the Bureau of Economic Analysis. Real GDP by metropolitan area growth ranged from 8.1 percent in Lake Charles, LA and Bend-Redmond, OR to -13.3 percent in Odessa, TX (table 2).

U.S. Current-Account Deficit Increases in Second Quarter 2017

September 19, 2017 | The BEA Wire

The U.S. current-account deficit increased to $123.1 billion (preliminary) in the second quarter of 2017 from $113.5 billion (revised) in the first quarter of 2017. As a percentage of U.S. GDP, the deficit increased to 2.6 percent from 2.4 percent. The previously published current-account deficit for the first quarter was $116.8 billion.

U.S. International Transactions, 2nd quarter 2017

September 19, 2017 | News Release

Current-Account Balance The U.S. current-account deficit increased to $123.1 billion (preliminary) in the second quarter of 2017 from $113.5 billion (revised) in the first quarter of 2017, according to statistics released by the Bureau of Economic Analysis (BEA).

Travel and Tourism Spending Stepped up in the Second Quarter

September 13, 2017 | The BEA Wire

Real spending (output) on travel and tourism accelerated in the second quarter of 2017, growing at an annual rate of 4.9 percent after increasing 4.4 percent (revised) in the first quarter, according to new statistics released by the Bureau of Economic Analysis.

Travel and Tourism Satellite Accounts, 2nd quarter 2017

September 13, 2017 | News Release

Real spending (output) on travel and tourism accelerated in the second quarter of 2017, growing at an annual rate of 4.9 percent after increasing 4.4 percent (revised) in the first quarter, according to new statistics released by the Bureau of Economic Analysis. Real gross domestic product (GDP) for the nation also accelerated, increasing 3.0 percent in the second quarter (second estimate) after increasing 1.2 percent in the first quarter of…

BEA Moves Ahead on Developing Plan to Measure the Economic Impact of Outdoor Recreation

September 7, 2017 | The BEA Wire

BEA is moving ahead on a project to develop a new set of statistics that measure how outdoor pursuits like fishing, camping, and hiking contribute to the economy. The Outdoor Recreation Satellite Account, or ORSA, will add up jobs, spending, and goods and services for leisure activities that range across the American landscape, from hang gliding through the sky, to diving into the sea. Release of the first experimental estimates is expected…

July 2017 Trade Gap is $43.7 Billion

September 6, 2017 | The BEA Wire

The U.S. monthly international trade deficit increased in July 2017 according to the U.S. Bureau of Economic Analysis and the U.S. Census Bureau. The deficit increased from $43.5 billion in June (revised) to $43.7 billion in July, as exports decreased more than imports. The previously published June deficit was $43.6 billion. The goods deficit decreased less than $0.1 billion in July to $65.3 billion. The services surplus decreased $0.2…

U.S. International Trade in Goods and Services, July 2017

September 6, 2017 | News Release

Total July exports of $194.4 billion and imports of $238.1 billion resulted in a goods and services deficit of $43.7 billion.

Gross Domestic Product for Guam, 2016

September 4, 2017 | News Release

This release is available as a PDF download.