
Bureau of Economic Analysis
U.S. International Transactions, 2nd Quarter 2025
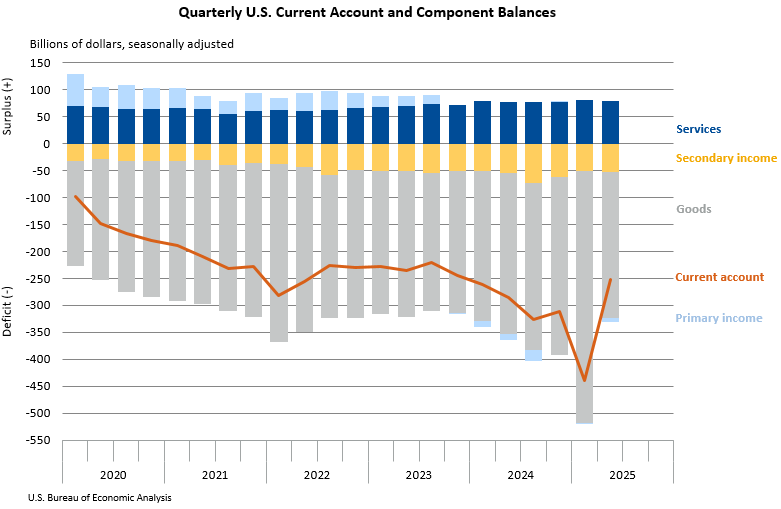
The U.S. current-account deficit narrowed by $188.5 billion, or 42.9 percent, to $251.3 billion in the second quarter of 2025, according to statistics released today by BEA. The revised first-quarter deficit was $439.8 billion. The second-quarter deficit was 3.3 percent of current-dollar gross domestic product, down from 5.9 percent in the first quarter.
Principal Federal Economic Indicators
Noteworthy


The Latest
Detailed Data on the Global Activities of U.S. Multinational Enterprises Coming out Dec. 16
Detailed statistics on the worldwide activities of U.S. multinational enterprises in 2014, including the finances and operations of U.S. parent companies and their foreign affiliates, will be available from the U.S. Bureau of Economic Analysis on Dec. 16.
BEA Unveiling New Data Tool Aimed at Faster Access to Economic Statistics in United States, Europe
In a show of collaboration between the United States and Europe, BEA is unveiling a new data tool that aims to make it easier to access, compare and visualize economic data between the two regions.
Spending on Treatment for Diseases and Medical Conditions
New! 2013 Data Available.
More medical conditions and price index data available at http://www.bea.gov/national/health_care_satellite_account.htm
September 2016 Trade Gap is $36.4 Billion
The U.S. monthly international trade deficit decreased in September 2016 according to the U.S. Bureau of Economic Analysis and the U.S. Census Bureau. The deficit decreased from $40.5 billion in August (revised) to $36.4 billion in September, as exports increased and imports decreased. The previously published August deficit was $40.7 billion. The goods deficit decreased $2.6 billion in September to $57.5 billion. The services surplus…
U.S. International Trade in Goods and Services, September 2016
U.S. Census Bureau U.S. Bureau of Economic Analysis NEWS U.S. Department of Commerce * Washington, DC 20230 U.S. INTERNATIONAL TRADE IN GOODS AND SERVICES September 2016 The U.S. Census Bureau and the U.S. Bureau of Economic Analysis, through the Department of Commerce, announced today that the goods and services deficit was $36.4 billion in September, down $4.0 billion from $…
Gross Domestic Product by Industry: Second Quarter 2016 Annual Update: 2013 through First Quarter 2016
Transportation and warehousing; health care and social assistance; and professional, scientific, and technical services were the leading contributors to the increase in U.S. economic growth in the second quarter of 2016. Overall, 15 of 22 industry groups contributed to the 1.4 percent increase in real GDP in the second quarter.
Gross Domestic Product by Industry, 2nd quarter 2016
Transportation and warehousing; health care and social assistance; and professional, scientific, and technical services were the leading contributors to the increase in U.S. economic growth in the second quarter of 2016. According to gross domestic product (GDP) by industry statistics released by the Bureau of Economic Analysis, 15 of 22 industry groups contributed to the overall 1.4 percent increase in real GDP in the second quarter.
BEA Releases New Batch of Health Care Statistics
The Bureau of Economic Analysis released a fresh set of statistics Wednesday detailing how much the United States spends to treat different diseases and medical conditions.
The numbers, which cover 2013, offer new insights into health care, which accounts for more than 17 percent of the U.S. economy.
Consumer Spending Rises in September
Personal income increased 0.3 percent in September after increasing 0.2 percent in August. Wages and salaries, the largest component of personal income, increased 0.3 percent in September after increasing 0.1 percent in August.
Personal Income and Outlays, September 2016
Personal income increased $46.7 billion (0.3 percent) in September according to estimates released today by the Bureau of Economic Analysis. Disposable personal income (DPI) increased $37.0 billion (0.3 percent) and personal consumption expenditures (PCE) increased $61.0 billion (0.5 percent). Real DPI increased less than 0.1 percent in September and Real PCE increased 0.3 percent. The PCE price index increased 0.2 percent.