Bureau of Economic Analysis
U.S. International Investment Position, 2nd Quarter 2025
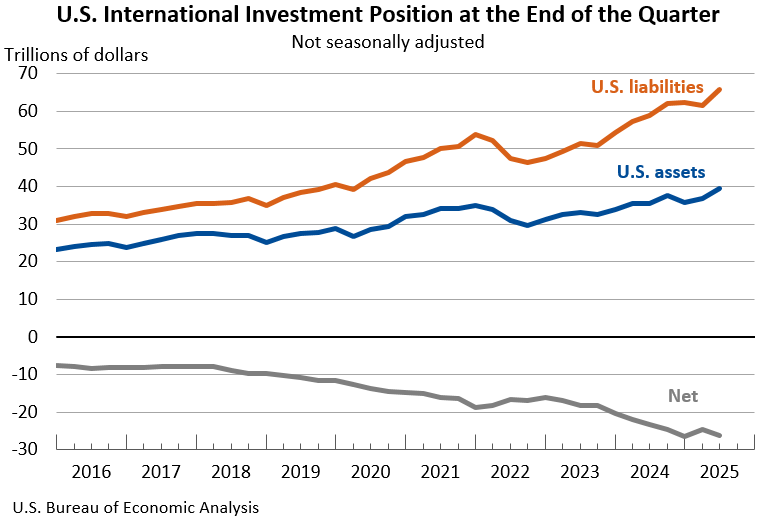
The U.S. net international investment position, the difference between U.S. residents’ foreign financial assets and liabilities, was -$26.14 trillion at the end of the second quarter of 2025, according to statistics released today by the U.S. Bureau of Economic Analysis. Assets totaled $39.56 trillion, and liabilities were $65.71 trillion. At the end of the first quarter, the net investment position was -$24.65 trillion (revised).
Principal Federal Economic Indicators
Noteworthy
The Latest
Travel and Tourism Satellite Accounts, 2nd quarter 2016
Real spending (output) on travel and tourism accelerated in the second quarter of 2016, increasing at an annual rate of 4.7 percent after increasing 1.2 percent (revised) in the first quarter according to new statistics released by the Bureau of Economic Analysis. By comparison, real gross domestic product (GDP) increased 1.1 percent in the second quarter after increasing 0.8 percent in the first.
Security Measures Keep Data Locked Tight Until the Time Is Right
U.S. gross domestic product is among the world’s most closely watched numbers, an economic indicator that moves markets, makes headlines and affects countless government and private decisions.
July 2016 Trade Gap is $39.5 Billion
The U.S. monthly international trade deficit decreased in July 2016 according to the U.S. Bureau of Economic Analysis and the U.S. Census Bureau. The deficit decreased from $44.7 billion in June (revised) to $39.5 billion in July, as exports increased and imports decreased. The previously published June deficit was $44.5 billion. The goods deficit decreased $5.3 billion in July to $60.3 billion. The services surplus decreased $0.1 billion in…
U.S. International Trade in Goods and Services, July 2016
U.S. Census Bureau U.S. Bureau of Economic Analysis NEWS U.S. Department of Commerce * Washington, DC 20230 U.S. INTERNATIONAL TRADE IN GOODS AND SERVICES July 2016 The U.S. Census Bureau and the U.S. Bureau of Economic Analysis, through the Department of Commerce, announced today that the goods and services deficit was $39.5 billion in July, down $5.2 billion from $…
Spending on Durable Goods Rises in July
Personal income increased 0.4 percent in July after increasing 0.3 percent in June. Wages and salaries, the largest component of personal income, increased 0.5 percent in July, the same increase as in June.
Personal Income and Outlays, July 2016
Personal income increased $71.6 billion (0.4 percent) in July according to estimates released today by the Bureau of Economic Analysis. Disposable personal income (DPI) increased $60.1 billion (0.4 percent) and personal consumption expenditures (PCE) increased $42.0 billion (0.3 percent). Real DPI increased 0.4 percent in July and Real PCE increased 0.3 percent. The PCE price index was unchanged from June.
Gross Domestic Product Second Quarter of 2016 (Second Estimate)
Real gross domestic product (GDP) increased 1.1 percent in the second quarter of 2016, according to the “second” estimate released by the Bureau of Economic Analysis. The growth rate was 0.1 percentage point less than the “advance” estimate released in July. In the first quarter, real GDP rose 0.8 percent.
Gross Domestic Product, 2nd quarter 2016 (second estimate); Corporate Profits, 2nd quarter 2016 (preliminary estimate)
Real gross domestic product increased at an annual rate of 1.1 percent in the second quarter of 2016 (table 1), according to the "second" estimate released by the Bureau of Economic Analysis. In the first quarter, real GDP increased 0.8 percent. The GDP estimate released today is based on more complete source data than were available for the "advance" estimate issued last month. In the advance estimate, the increase in real GDP was 1.2…
Statistics on U.S. Affiliates of Foreign Multinational Enterprises Now Available for 2014; Data for 2013 Updated
New statistics detailing the activities of U.S. affiliates of foreign multinational enterprises (MNEs) are now available from the U.S. Bureau of Economic Analysis. The statistics, which include the first information for 2014 and updated data for 2013, offer details on the finances and operations of U.S.
Gross Domestic Product for American Samoa, 2015
This release is available as a PDF download.


