Bureau of Economic Analysis
New Foreign Direct Investment in the United States, 2024
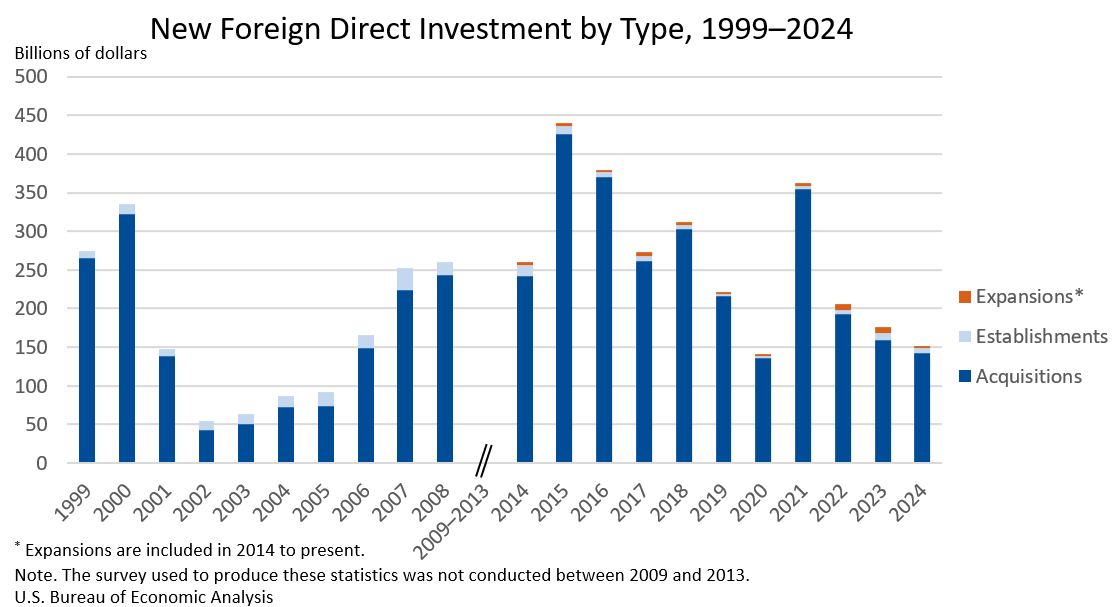
Expenditures by foreign direct investors to acquire, establish, or expand U.S. businesses totaled $151.0 billion in 2024, according to preliminary statistics released today by the U.S. Bureau of Economic Analysis. Expenditures decreased $24.9 billion, or 14.2 percent, from $176.0 billion (revised) in 2023 and were below the annual average of $277.2 billion for 2014–2023. As in previous years, acquisitions of existing U.S. businesses accounted for most of the expenditures.
Principal Federal Economic Indicators
Noteworthy
- 2025 News Release Schedule
- Innovation at BEA
- 2025 Annual Updates
- New! Services Trade Data for More Countries
- Data Tool: Trade in Value Added
- Distribution of State Personal Income
- Updated: RIMS II Regional Multipliers
- Arts and Culture
- Space Economy
- FDI Now in State BEARFACTS
- Quick Guide: Price Indexes
The Latest
State Personal Income: Fourth Quarter 2015
State personal income grew 0.8 percent on average in the fourth quarter of 2015, down from 1.0 percent in the third quarter. Thirty-three states, including the four largest states California, Texas, Florida, and New York had slower growth in personal income in the fourth quarter than in the third quarter. Growth rates ranged from -0.1 percent in Wyoming, Oklahoma, and Nebraska to 1.3 percent in Michigan.
State Personal Income 2015
State personal income grew on average 4.4 percent in 2015, the same rate as in 2014. Growth of state personal income—the sum of net earnings by place of residence, property income, and personal current transfer receipts—ranged from -0.2 percent in North Dakota to 6.3 percent in California.
State Quarterly Personal Income, 1st quarter 2015 - 4th quarter 2015; State Annual Personal Income, 2015 (preliminary estimate)
State personal income grew on average 4.4 percent in 2015, the same rate as in 2014, according to estimates released today by the U.S. Bureau of Economic Analysis. Growth of state personal income—the sum of net earnings by place of residence, property income, and personal current transfer receipts—ranged from -0.2 percent in North Dakota to 6.3 percent in California (table 1).
U.S. Current-Account Deficit Decreases in Fourth Quarter 2015
The U.S. current-account deficit—a net measure of transactions between the United States and the rest of the world in goods, services, primary income (investment income and compensation), and secondary income (current transfers)—decreased to $125.3 billion (preliminary) in the fourth quarter of 2015 from $129.9 billion (revised) in the third quarter of 2015. As a percentage of U.S. GDP, the deficit decreased to 2.8 percent from 2.9 percent.…
U.S. International Transactions, 4th quarter and Year 2015
Current Account The U.S. current-account deficit—a net measure of transactions between the United States and the rest of the world in goods, services, primary income (investment income and compensation), and secondary income (current transfers)—decreased to $125.3 billion (preliminary) in the fourth quarter of 2015 from $129.9 billion (revised) in the third quarter. The deficit decreased to 2.8…
Travel and Tourism Spending Decelerated in Fourth Quarter of 2015
Inflation adjusted spending (or output) on travel and tourism decelerated in the fourth quarter of last year, increasing at an annual rate of 1.7 percent, after rising 4.5 percent in the third quarter.
For comparison, inflation-adjusted — or real — gross domestic product also decelerated during the same period, increasing 1.0 percent in the fourth quarter, after rising 2.0 percent.
BEA Data Provide a Look into America's Shopping Carts
America’s consumers spent more than $12 trillion last year on all kinds of stuff, including new
Travel and Tourism Satellite Accounts, 4th quarter 2015
Real spending (output) on travel and tourism decelerated in the fourth quarter of 2015, increasing at an annual rate of 1.7 percent after increasing 4.5 percent (revised) in the third quarter of 2015. Real gross domestic product (GDP) also decelerated, increasing 1.0 percent in the fourth quarter (second estimate) after increasing 2.0 percent. For the year, travel and tourism spending grew 4.4 percent after increasing 3.1 percent in 2014.
January 2016 Trade Gap is $45.7 Billion
The U.S. monthly international trade deficit increased in January 2016 according to the U.S. Bureau of Economic Analysis and the U.S. Census Bureau. The deficit increased from $44.7 billion in December (revised) to $45.7 billion in January, as exports decreased more than imports. The previously published December deficit was $43.4 billion. The goods deficit increased $1.1 billion from December to $63.7 billion in January. The services…
U.S. International Trade in Goods and Services, January 2016
U.S. Census Bureau U.S. Bureau of Economic Analysis NEWS U.S. Department of Commerce * Washington, DC 20230 U.S. INTERNATIONAL TRADE IN GOODS AND SERVICES January 2016 The U.S. Census Bureau and the U.S.


