Bureau of Economic Analysis
U.S. International Trade in Goods and Services, June 2025
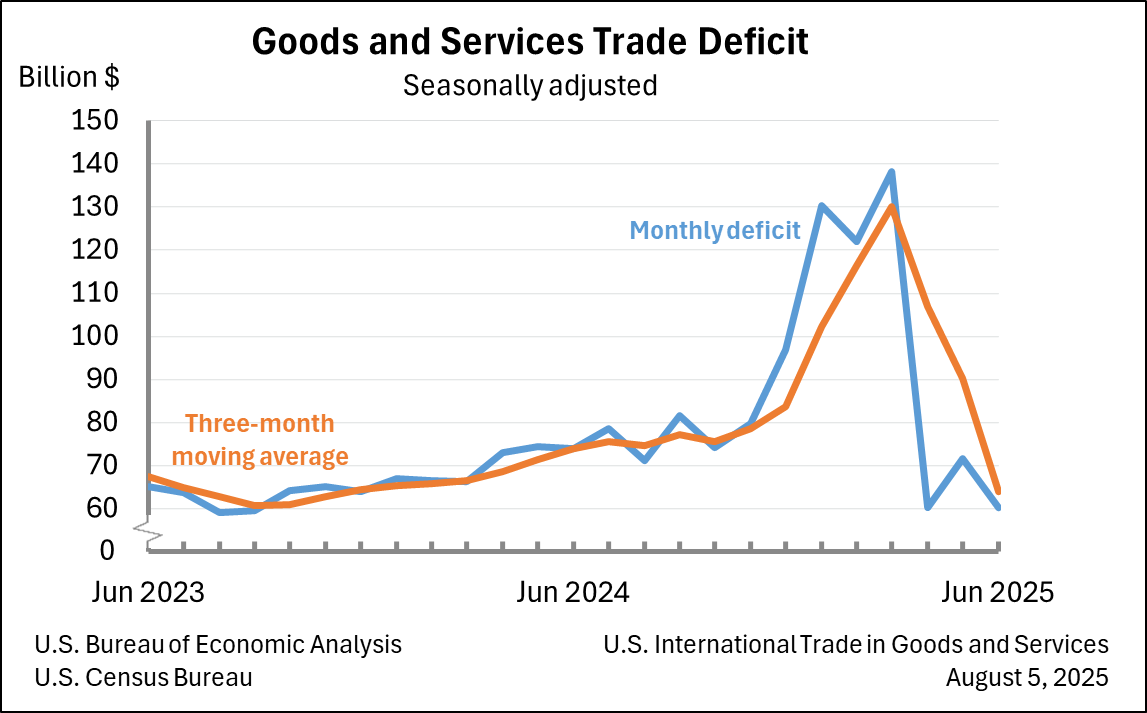
The U.S. goods and services trade deficit decreased in June 2025 according to the U.S. Bureau of Economic Analysis and the U.S. Census Bureau. The deficit decreased from $71.7 billion in May (revised) to $60.2 billion in June, as exports decreased less than imports. The goods deficit decreased $11.4 billion in June to $85.9 billion. The services surplus increased $0.1 billion in June to $25.7 billion.
Principal Federal Economic Indicators
Noteworthy
- 2025 News Release Schedule
- Innovation at BEA
- 2025 Annual Updates
- New! Services Trade Data for More Countries
- Data Tool: Trade in Value Added
- Distribution of State Personal Income
- Updated: RIMS II Regional Multipliers
- Arts and Culture
- Space Economy
- FDI Now in State BEARFACTS
- Quick Guide: Price Indexes
The Latest
Bureau of Economic Analysis Releases Two New Data Sets to Deepen Understanding of U.S. Economy
In the past two days, the Commerce Department’s Bureau of Economic Analysis (BEA) has released two brand new sets of economic statistics that business people, entrepreneurs, policy makers, households and others can use to make more informed decisions in their professional and personal lives.
Guam's Economy Grew 1 Percent in 2014
Guam’s real gross domestic product — adjusted to remove price changes — increased 1 percent in 2014. For comparison, economic growth for the United States (excluding the territories) increased 2.4 percent during the same period.
Growth in Guam was widespread among the components of GDP and included increases in private fixed investment, government spending and consumer spending. Growth in these components was partly…
BEA Introduces New Measures of the Regional Economy
Today, the U.S. Bureau of Economic Analysis released official statistics on personal consumption expenditures (PCE) by state for 1997-2014. PCE by state – the measure of goods and services purchased by or on behalf of households by state of residence – provides insight into household spending patterns across states and can be used together with other regional data to gain a better understanding of regional economies.
Personal Consumption Expenditures by State, 1997-2014
Today, the U.S. Bureau of Economic Analysis released its first set of official statistics on personal consumption expenditures (PCE) by state for 1997-20141. PCE by state – the measure of goods and services purchased by or on behalf of households by state of residence – provides insight into household spending patterns across states and can be used together with other regional data to gain a better understanding of regional economies.
New Statistics Detailing New Investment in the United States by Foreign Direct Investors Are Now Available
Statistics detailing the amount and type of new investment made in the United States by foreign direct investors to acquire, establish, or expand U.S. businesses are now available from the Bureau of Economic Analysis. The statistics cover new investments initiated in 2014 and offer details on these investments, including the countries from which the new investment originates, the U.S. industries that are drawing new investments, and U.S.…
New Foreign Direct Investment in the United States, 2014
Expenditures by foreign direct investors for new investment—that is, to acquire, establish, or expand U.S. businesses—totaled $241.3 billion in 2014, according to the Bureau of Economic Analysis (BEA) in statistics released today. Acquisitions accounted for most of the investment.
BEA to Release New Statistics Detailing Consumer Spending in Every State for 2014
New statistics detailing consumer spending by state will be released Tuesday, Dec. 1 at 8:30 a.m. eastern time by the U.S. Bureau of Economic Analysis.
Personal Income Increases in October
Personal income increased 0.4 percent in October, after increasing 0.2 percent in September. Wages and salaries, the largest component of personal income increased 0.6 percent in October after remaining flat in September.
Current-dollar disposable personal income (DPI), after-tax income, increased 0.4 percent in October after increasing 0.2 percent in September.
Real DPI, income adjusted for taxes and inflation…
Personal Income and Outlays, October 2015
Personal income increased $68.1 billion, or 0.4 percent, and disposable personal income (DPI) increased $56.8 billion, or 0.4 percent, in October, according to the Bureau of Economic Analysis. Personal consumption expenditures (PCE) increased $15.2 billion, or 0.1 percent.


