Bureau of Economic Analysis
Annual Update of GDP, Industry, and State Statistics Starts Sept. 25
Release of the annual update of gross domestic product and related statistics, including GDP by industry, begins Sept. 25. Updates of state and county statistics start Sept. 26.
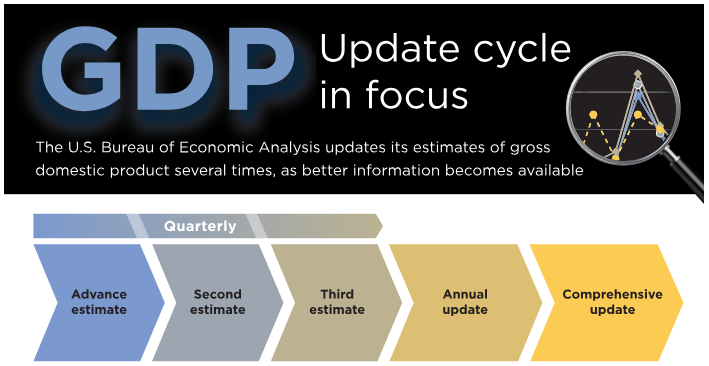
Regular annual updates enable the U.S. Bureau of Economic Analysis to refine our estimates as more complete source data become available. They are also a time to bring in improvements in methodology and presentation. This year, we'll introduce data on business investment in data centers.
Principal Federal Economic Indicators
Noteworthy
The Latest
Coming Soon: Real Personal Income Statistics for States and Metropolitan Areas
The Bureau of Economic Analysis will soon release real personal income statistics using regional price indexes to adjust BEA’s personal income data for differences in the cost of living across states and metro areas. These new statistics will inform decisions by businesses and households alike – from deciding where to move for a new job or locating a new company to helping economic development offices shape regional marketing plans and…
February 2014 Trade Gap Is $42.3 Billion
The U.S. monthly international trade deficit increased in February 2014 according to the U.S. Bureau of Economic Analysis and the U.S. Census Bureau. The deficit increased from $39.3 billion in January (revised) to $42.3 billion in February as exports decreased and imports increased. The previously published January deficit was $39.1 billion. The goods deficit increased $2.2 billion from January to $61.7 billion in February; the services…
U.S. International Trade in Goods and Services, February 2014
U.S. Census Bureau U.S. Bureau of Economic Analysis NEWS U.S. Department of Commerce * Washington, DC 20230 U.S. INTERNATIONAL TRADE IN GOODS AND SERVICES February 2014 Goods and Services The U.S. Census Bureau and the U.S.
Real Consumer Spending Rises in February
Personal income increased 0.3 percent in February, the same as in January. Wages and salaries, the largest component of personal income, increased 0.2 percent after increasing 0.3 percent.
Current-dollar disposable personal income (DPI), after-tax income, increased 0.3 percent in February, the same as in January.
Real DPI, income adjusted for taxes and inflation, increased 0.3 percent in February after increasing 0.2 percent…
Personal Income and Outlays, February 2014
Personal income increased $47.7 billion, or 0.3 percent, and disposable personal income (DPI) increased $42.3 billion, or 0.3 percent, in February, according to the Bureau of Economic Analysis. Personal consumption expenditures (PCE) increased $30.8 billion, or 0.3 percent. In January, personal income increased $41.3 billion, or 0.3 percent, DPI increased $40.3 billion, or 0.3 percent, and PCE increased $20.0 billion, or 0.2 percent, based on…
GDP Growth Slows In Fourth Quarter
Real gross domestic product (GDP) increased 2.6 percent in the fourth quarter of 2013, according to the “third” estimate released by the Bureau of Economic Analysis. The growth rate was 0.2 percentage point more than the “second” estimate released in February. In the third quarter, the growth rate was 4.1 percent.
Gross Domestic Product, 4th quarter and annual 2013 (third estimate); Corporate Profits, 4th quarter and annual 2013
Real gross domestic product -- the output of goods and services produced by labor and property located in the United States -- increased at an annual rate of 2.6 percent in the fourth quarter of 2013 (that is, from the third quarter to the fourth quarter), according to the "third" estimate released by the Bureau of Economic Analysis. In the third quarter, real GDP increased 4.1 percent. The GDP estimate released today is based on…
Value of Both Foreign Investments in the United States and U.S. Investments Abroad Increased in Fourth Quarter 2013
The U.S. net international investment position was -$4,577.5 billion (preliminary) at the end of the fourth quarter of 2013 as the value of foreign investments in the United States exceeded the value of U.S. investments abroad. At the end of the third quarter, the net position was -$4,171.8 billion (revised).
Value of Both Foreign Investments in the United States and U.S. Investments Abroad Increased in 2013
The U.S. net international investment position was -$4,577.5 billion (preliminary) at the end of 2013 as the value of foreign investments in the United States exceeded the value of U.S. investments abroad. At the end of 2012, the net position was -$3,863.9 billion.
The $713.6 billion decrease in the net position from the end of 2012 to the end of 2013 reflected a $1,039.8 billion increase in the value of foreign-owned assets in the…
U.S. International Investment Position, 4th quarter and year 2013
Comprehensive Restructuring of the U.S. International Economic Accounts
On June 30, 2014, BEA will release "U.S. Net International Investment Position: End of the First Quarter 2014, Year 2013, and Annual Revisions." The statistics will be revised to reflect newly available and more complete source data, changes in estimation methods, and changes in definitions and classifications.


