Bureau of Economic Analysis
U.S. International Investment Position, 2nd Quarter 2025
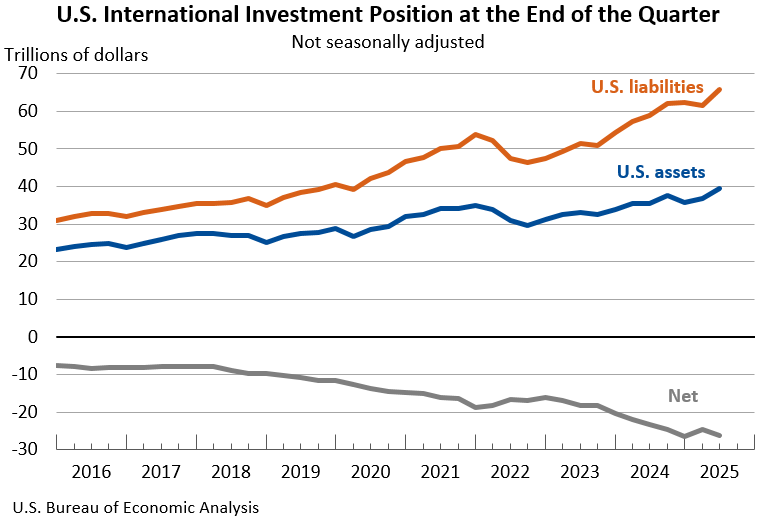
The U.S. net international investment position, the difference between U.S. residents’ foreign financial assets and liabilities, was -$26.14 trillion at the end of the second quarter of 2025, according to statistics released today by the U.S. Bureau of Economic Analysis. Assets totaled $39.56 trillion, and liabilities were $65.71 trillion. At the end of the first quarter, the net investment position was -$24.65 trillion (revised).
Principal Federal Economic Indicators
Noteworthy
The Latest
Gross Domestic Product by Industry, 4th quarter and annual 2013
The Bureau of Economic Analysis released today – for the first time – gross domestic product (GDP) by industry for 22 industry sectors on a quarterly basis. These new statistics fill an important gap in U.S. federal economic statistics by providing timely information on how individual industries contributed to U.S. economic growth in a given quarter. These new data also provide businesses with a comprehensive and consistent tool for…
BEA Introduces New Measures of the Regional Economy—Estimates of Real Personal Income for States, 2008–2012
Today, the U.S. Bureau of Economic Analysis released real, price-adjusted estimates of personal income for states and metropolitan areas for 2008-2012. The price-adjustments are based on regional price parities (RPPs) and on BEA’s national Personal Consumption Expenditure (PCE) price index. The RPPs measure geographic differences in the price levels of consumption goods and services relative to the national average, and the PCE…
BEA Introduces New Measures of the Regional Economy—Estimates of Real Personal Income for Metropolitan Areas, 2008–2012
Today, the U.S. Bureau of Economic Analysis released real, price-adjusted estimates of personal income for states and metropolitan areas for 2008-2012. The price-adjustments are based on regional price parities (RPPs) and on BEA’s national Personal Consumption Expenditure (PCE) price index. The RPPs measure geographic differences in the price levels of consumption goods and services relative to the national average, and the PCE…
Real Personal Income for States and Metropolitan Areas, 2008-2012
Today, the U.S. Bureau of Economic Analysis released real, price-adjusted estimates of personal income for states and metropolitan areas for 2008-2012.
Coming Soon: New Statistics Will Provide More Timely Snapshot of How Industries are Performing
Want to know how much manufacturing contributed to U.S. economic growth in a given quarter? How about educational services?
For the first time, the Bureau of Economic Analysis (BEA) will soon start producing on a regular basis quarterly estimates of economic activity generated by 22 industries.
Coming Soon: Real Personal Income Statistics for States and Metropolitan Areas
The Bureau of Economic Analysis will soon release real personal income statistics using regional price indexes to adjust BEA’s personal income data for differences in the cost of living across states and metro areas. These new statistics will inform decisions by businesses and households alike – from deciding where to move for a new job or locating a new company to helping economic development offices shape regional marketing plans and…
February 2014 Trade Gap Is $42.3 Billion
The U.S. monthly international trade deficit increased in February 2014 according to the U.S. Bureau of Economic Analysis and the U.S. Census Bureau. The deficit increased from $39.3 billion in January (revised) to $42.3 billion in February as exports decreased and imports increased. The previously published January deficit was $39.1 billion. The goods deficit increased $2.2 billion from January to $61.7 billion in February; the services…
U.S. International Trade in Goods and Services, February 2014
U.S. Census Bureau U.S. Bureau of Economic Analysis NEWS U.S. Department of Commerce * Washington, DC 20230 U.S. INTERNATIONAL TRADE IN GOODS AND SERVICES February 2014 Goods and Services The U.S. Census Bureau and the U.S.
Real Consumer Spending Rises in February
Personal income increased 0.3 percent in February, the same as in January. Wages and salaries, the largest component of personal income, increased 0.2 percent after increasing 0.3 percent.
Current-dollar disposable personal income (DPI), after-tax income, increased 0.3 percent in February, the same as in January.
Real DPI, income adjusted for taxes and inflation, increased 0.3 percent in February after increasing 0.2 percent…
Personal Income and Outlays, February 2014
Personal income increased $47.7 billion, or 0.3 percent, and disposable personal income (DPI) increased $42.3 billion, or 0.3 percent, in February, according to the Bureau of Economic Analysis. Personal consumption expenditures (PCE) increased $30.8 billion, or 0.3 percent. In January, personal income increased $41.3 billion, or 0.3 percent, DPI increased $40.3 billion, or 0.3 percent, and PCE increased $20.0 billion, or 0.2 percent, based on…


