
Bureau of Economic Analysis
Personal Income and Outlays, July 2025
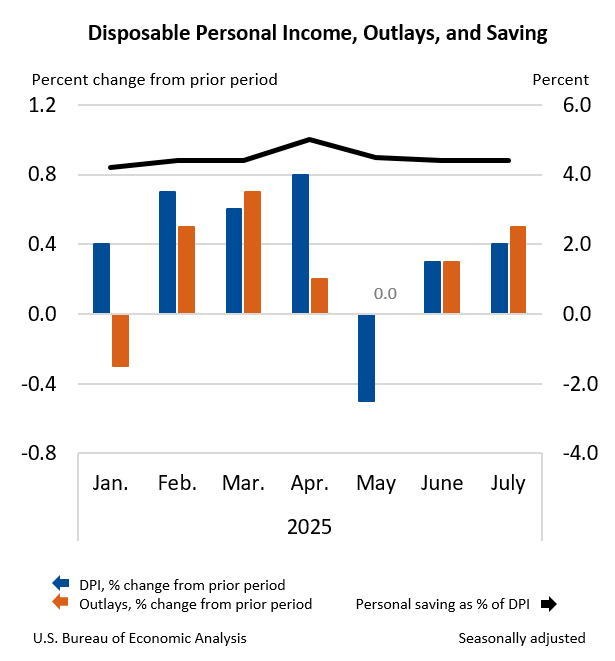
Personal income increased $112.3 billion (0.4 percent at a monthly rate) in July, according to estimates released today by the U.S. Bureau of Economic Analysis. Disposable personal income (DPI)—personal income less personal current taxes—increased $93.9 billion (0.4 percent) and personal consumption expenditures (PCE) increased $108.9 billion (0.5 percent). Personal outlays—the sum of PCE, personal interest payments, and personal current transfer payments—increased $110.9 billion in July. Personal saving was $985.6 billion in July and the personal saving rate—personal saving as a percentage of disposable personal income—was 4.4 percent.
Principal Federal Economic Indicators
Noteworthy


The Latest
U.S. International Investment Position Third Quarter 2020
The U.S. net international investment position, the difference between U.S. residents’ foreign financial assets and liabilities, was –$13.95 trillion at the end of the third quarter of 2020, according to statistics released by the U.S. Bureau of Economic Analysis (BEA). Assets totaled $29.41 trillion and liabilities were $43.36 trillion. At the end of the second quarter, the net investment position was –$13.08 trillion.
U.S. International Investment Position, Third Quarter 2020
The U.S. net international investment position, the difference between U.S. residents’ foreign financial assets and liabilities, was –$13.95 trillion at the end of the third quarter of 2020, according to statistics released by the U.S. Bureau of Economic Analysis (BEA). Assets totaled $29.41 trillion and liabilities were $43.36 trillion. At the end of the second quarter, the net investment position was –$13.08 trillion.
Gross Domestic Product by State, 3rd Quarter 2020
Real gross domestic product (GDP) increased in all 50 states and the District of Columbia in the third quarter of 2020, as real GDP for the nation increased at an annual rate of 33.4 percent. The percent change in real GDP in the third quarter ranged from 52.2 percent in Nevada to 19.2 percent in the District of Columbia.
Personal Income and Outlays, November 2020
Personal income decreased 1.1 percent while consumer spending decreased 0.4 percent in November as federal economic recovery payments and pandemic-related assistance programs continued to wind down.
Personal Income and Outlays, November 2020
Personal income decreased 1.1 percent while consumer spending decreased 0.4 percent in November as federal economic recovery payments and pandemic-related assistance programs continued to wind down.
Gross Domestic Product (Third Estimate), Corporate Profits (Revised), and GDP by Industry, Third Quarter 2020
Real gross domestic product (GDP) increased at an annual rate of 33.4 percent in the third quarter of 2020, as efforts continued to reopen businesses and resume activities that were postponed or restricted due to COVID-19. The change was 0.3 percentage point higher than the “second” estimate released in November. In the second quarter of 2020, real GDP decreased 31.4 percent. For more details, including source data, see the Technical Note and…
Gross Domestic Product (Third Estimate), Corporate Profits (Revised), and GDP by Industry, Third Quarter 2020
Real gross domestic product (GDP) increased at an annual rate of 33.4 percent in the third quarter of 2020, as efforts continued to reopen businesses and resume activities that were postponed or restricted due to COVID-19. The change was 0.3 percentage point higher than the “second” estimate released in November. In the second quarter of 2020, real GDP decreased 31.4 percent.
U.S. Current Account Deficit Widens In Third Quarter 2020
The U.S. current account deficit, which reflects the combined balances on trade in goods and services and income flows between U.S. residents and residents of other countries, widened by $17.2 billion, or 10.6 percent, to $178.5 billion in the third quarter of 2020. The widening reflected an expanded deficit on goods that was partly offset by an expanded surplus on primary income. The third quarter deficit was 3.4 percent of current dollar…
U.S. International Transactions, Third Quarter 2020
The U.S. current account deficit widened by $17.2 billion, or 10.6 percent, to $178.5 billion in the third quarter of 2020, according to statistics released by the U.S. Bureau of Economic Analysis. The revised second quarter deficit was $161.4 billion. The third quarter deficit was 3.4 percent of current dollar gross domestic product, up from 3.3 percent in the second quarter.