Bureau of Economic Analysis
Gross Domestic Product by County and Personal Income by County, 2024
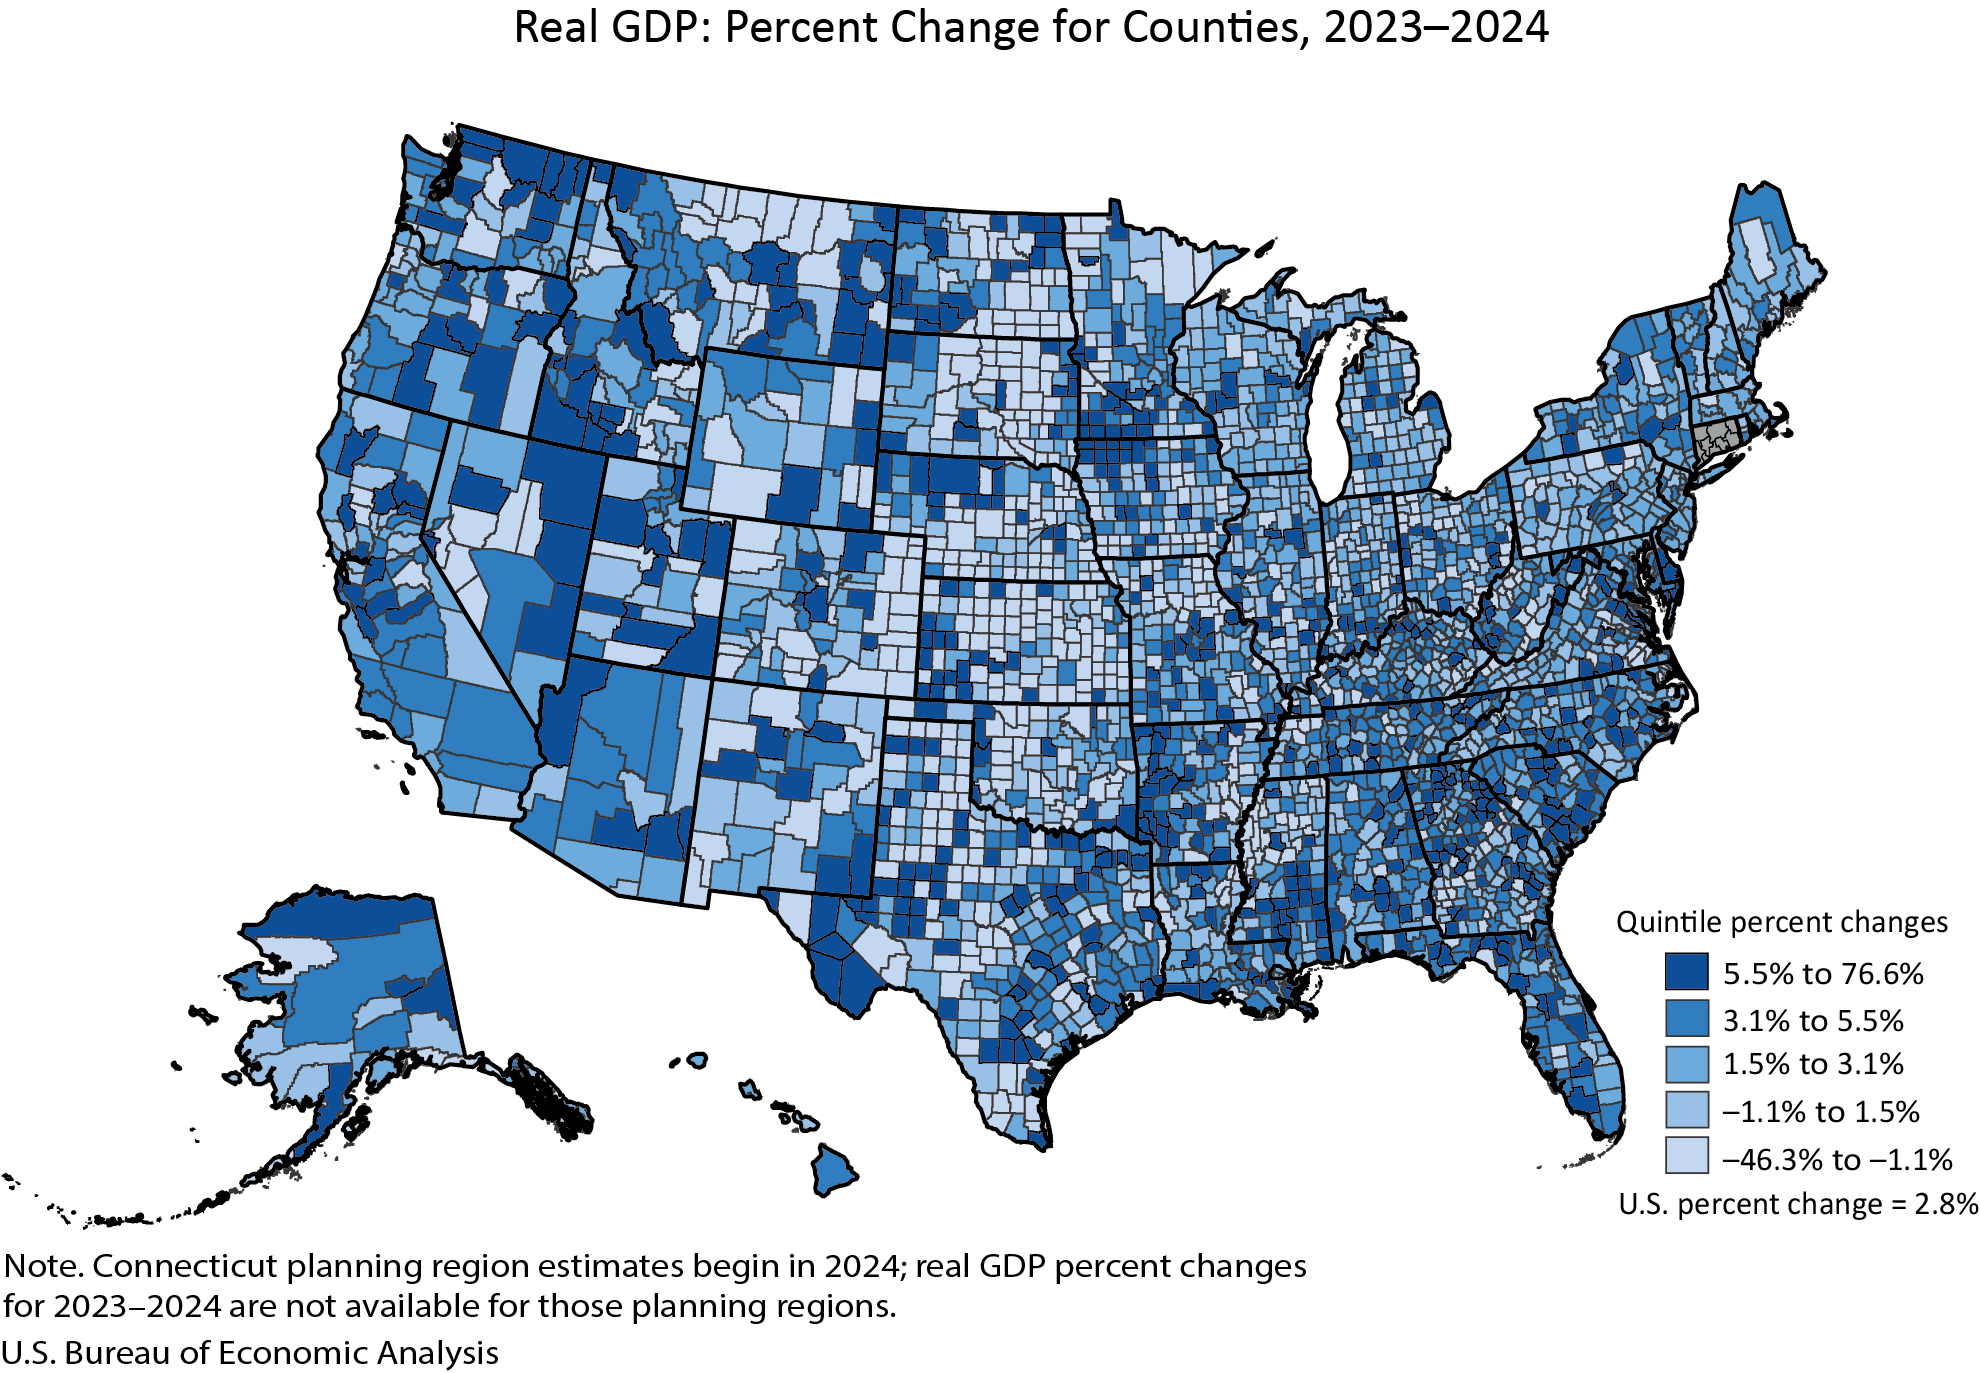
Real gross domestic product (GDP) increased in 2,273 counties, decreased in 809 counties, and was unchanged in 24 counties in 2024. County-level changes ranged from a 76.6 percent increase in Carter County, MT, to a 46.3 percent decline in Baca County, CO.
Personal income, in current dollars, increased in 2,768 counties, decreased in 331, and was unchanged in 7 counties in 2024. County-level changes ranged from a 22.6 percent increase in Harding County, SD, to a 23.3 percent decline in Issaquena County, MS.
Principal Federal Economic Indicators
Noteworthy
The Latest
Personal Income and Outlays, January 2025
Personal income increased $221.9 billion (0.9 percent at a monthly rate) in January, according to estimates released today by the U.S. Bureau of Economic Analysis. Disposable personal income (DPI)—personal income less personal current taxes—increased $194.3 billion (0.9 percent) and personal consumption expenditures (PCE) decreased $30.7 billion (0.2 percent). Personal outlays—the sum of PCE, personal interest payments, and personal current…
Gross Domestic Product, 4th Quarter and Year 2024 (Second Estimate)
Real gross domestic product (GDP) increased at an annual rate of 2.3 percent in the fourth quarter of 2024, according to the second estimate. In the third quarter, real GDP increased 3.1 percent. The increase in real GDP in the fourth quarter primarily reflected increases in consumer spending and government spending that were partly offset by a decrease in investment. Imports, which are a subtraction in the calculation of GDP, decreased.
Travel and Tourism Satellite Account for 2018-2023
The travel and tourism industry—as measured by the real output of goods and services sold directly to visitors— increased 7.0 percent in 2023 after increasing 20.8 percent in 2022, according to the most recent statistics from BEA’s Travel and Tourism Satellite Account.
U.S. International Trade in Goods and Services, December and Annual 2024
The U.S. monthly international trade deficit increased in December 2024 according to the U.S. Bureau of Economic Analysis and the U.S. Census Bureau. The deficit increased from $78.9 billion in November (revised) to $98.4 billion in December, as imports increased and exports decreased. The goods deficit increased $18.9 billion in December to $123.0 billion. The services surplus decreased $0.6 billion in December to $24.5 billion.
Personal Income and Outlays, December 2024
Personal income increased $92.0 billion (0.4 percent at a monthly rate) in December, according to estimates released today by the U.S. Bureau of Economic Analysis. Disposable personal income (DPI)—personal income less personal current taxes—increased $79.7 billion (0.4 percent) and personal consumption expenditures (PCE) increased $133.6 billion (0.7 percent). Personal outlays—the sum of PCE, personal interest payments, and personal current…
Streamlining of News Release Packages Continues
The Bureau of Economic Analysis is streamlining our news release packages to reduce duplication and make it easier to find the information you need.
We have phased out news release highlights, which began years ago as abbreviated one-page documents for delivery by fax. The highlights mostly repeated news release content. In some cases, such as U.S. Personal Income and Outlays, extra elements like charts previously included in the…
Gross Domestic Product, 4th Quarter and Year 2024 (Advance Estimate)
Real gross domestic product (GDP) increased at an annual rate of 2.3 percent in the fourth quarter of 2024, according to the advance estimate. In the third quarter, real GDP increased 3.1 percent. The increase in real GDP in the fourth quarter primarily reflected increases in consumer spending and government spending that were partly offset by a decrease in investment. Imports, which are a subtraction in the calculation of GDP, decreased.
U.S. International Trade in Goods and Services, November 2024
The U.S. monthly international trade deficit increased in November 2024 according to the U.S. Bureau of Economic Analysis and the U.S. Census Bureau. The deficit increased from $73.6 billion in October (revised) to $78.2 billion in November, as imports increased more than exports. The goods deficit increased $5.4 billion in November to $103.4 billion. The services surplus increased $0.9 billion in November to $25.2 billion.
U.S. International Investment Position, 3rd Quarter 2024
The U.S. net international investment position, the difference between U.S. residents’ foreign financial assets and liabilities, was -$23.60 trillion at the end of the third quarter of 2024, according to statistics released today by the U.S. Bureau of Economic Analysis. Assets totaled $37.86 trillion, and liabilities were $61.46 trillion. At the end of the second quarter, the net investment position was -$22.55 trillion (revised).
Gross Domestic Product by State and Personal Income by State, 3rd Quarter 2024
Real gross domestic product increased in 46 states and the District of Columbia in the third quarter of 2024, with the percent change ranging from 6.9 percent at an annual rate in Arkansas to –2.3 percent in North Dakota. Personal income, in current dollars, increased in 49 states and the District of Columbia, with the percent change ranging from 5.4 percent at an annual rate in Arkansas to –0.7 percent in North Dakota.


