Bureau of Economic Analysis
Gross Domestic Product by County and Personal Income by County, 2024
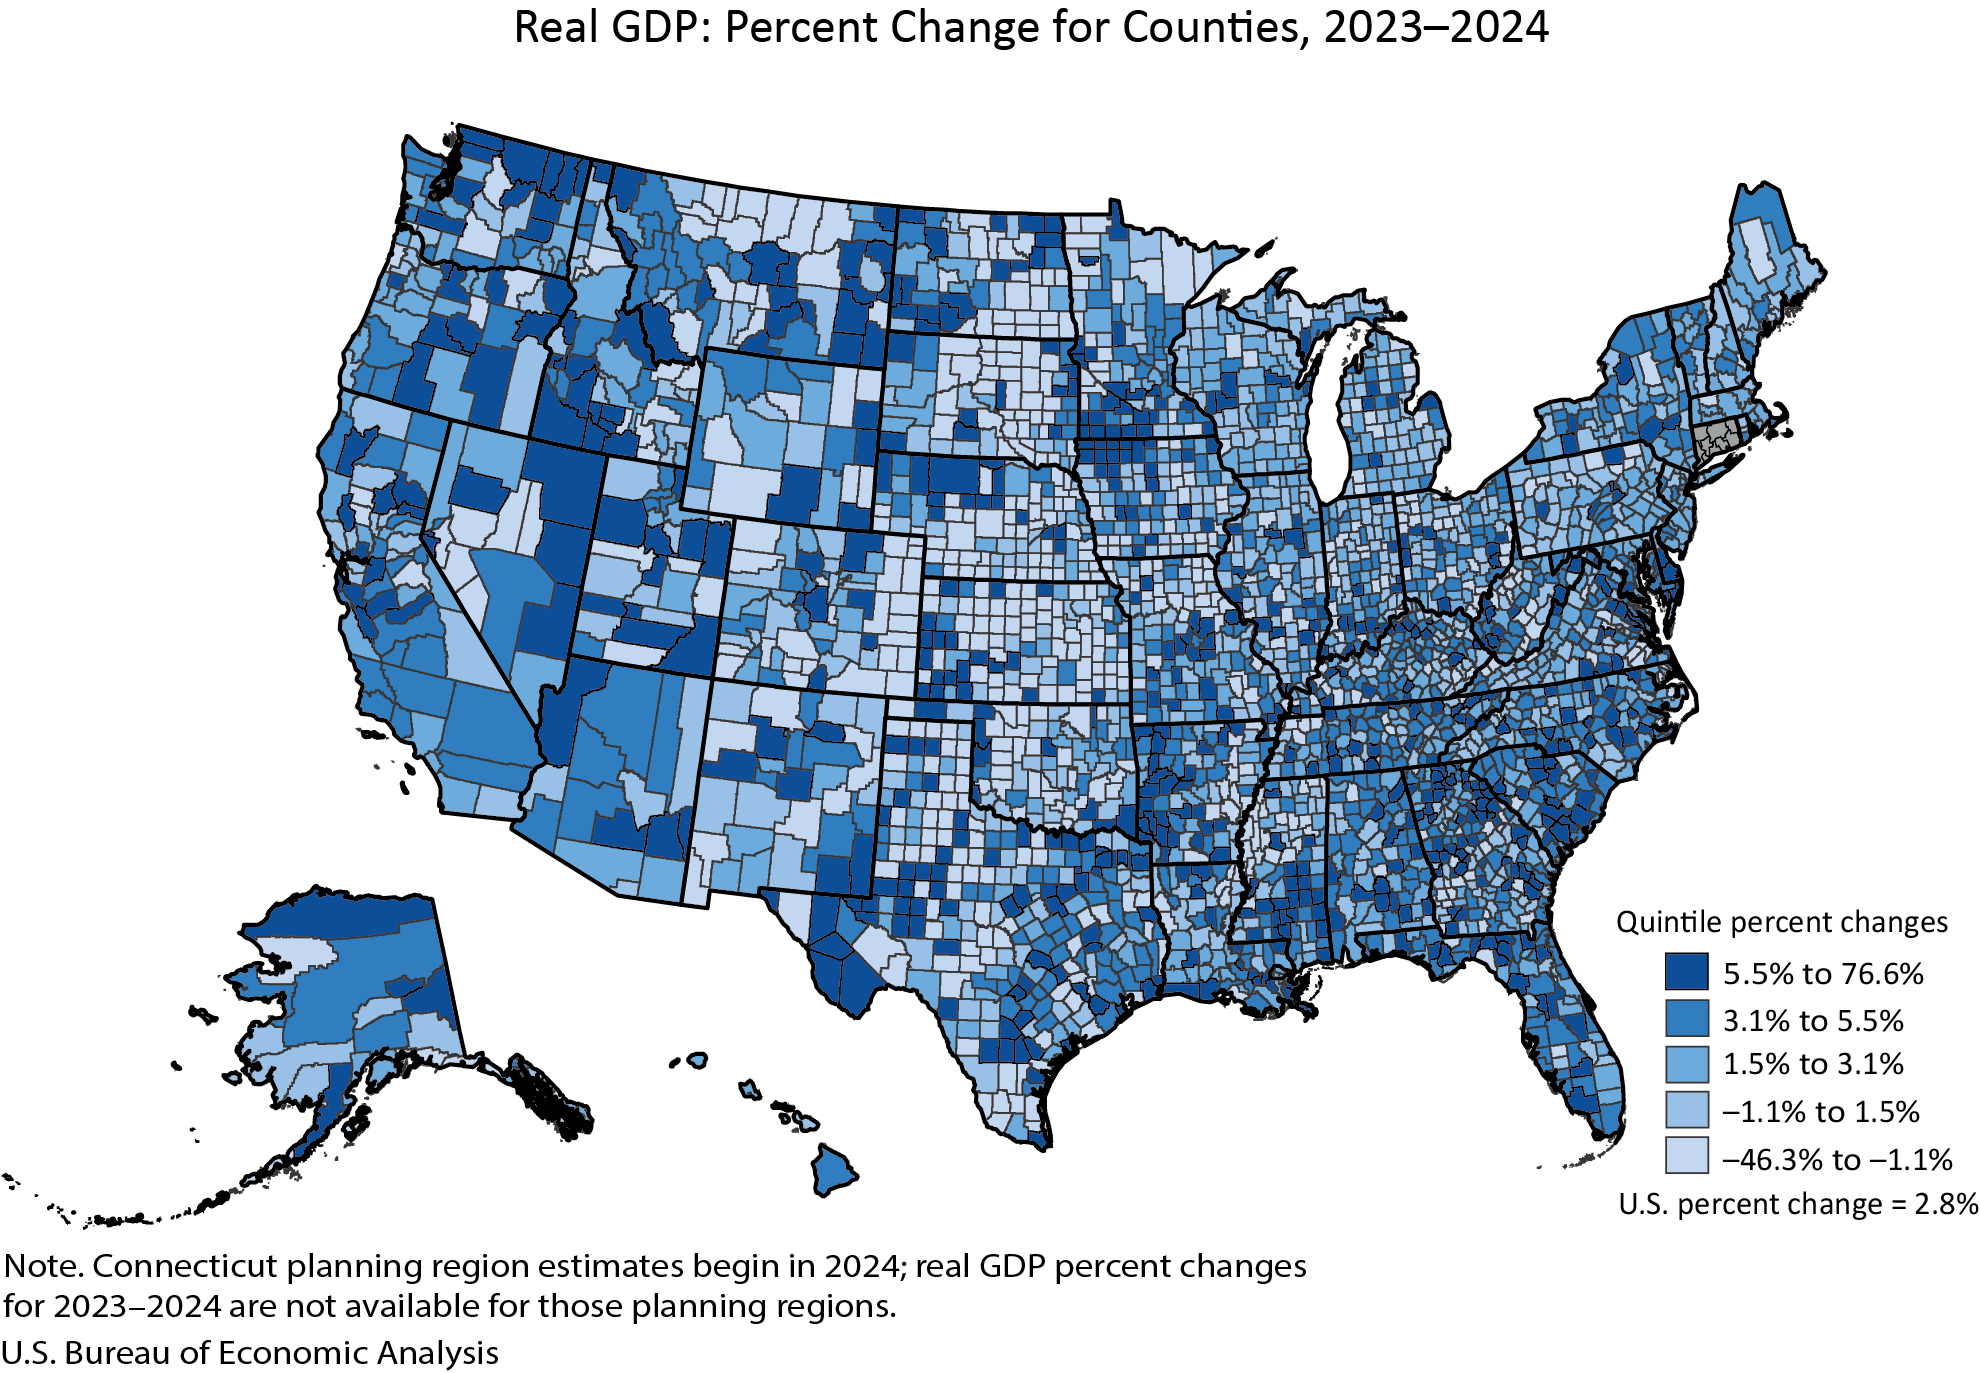
Real gross domestic product (GDP) increased in 2,273 counties, decreased in 809 counties, and was unchanged in 24 counties in 2024. County-level changes ranged from a 76.6 percent increase in Carter County, MT, to a 46.3 percent decline in Baca County, CO.
Personal income, in current dollars, increased in 2,768 counties, decreased in 331, and was unchanged in 7 counties in 2024. County-level changes ranged from a 22.6 percent increase in Harding County, SD, to a 23.3 percent decline in Issaquena County, MS.
Principal Federal Economic Indicators
Noteworthy
The Latest
2019 Trade Gap is $616.8 Billion
The U.S. international trade deficit decreased in 2019 according to the U.S. Bureau of Economic Analysis and the U.S. Census Bureau. The deficit decreased from $627.7 billion in 2018 to $616.8 billion in 2019, as imports decreased more than exports. As a percentage of U.S. gross domestic product, the goods and services deficit was 2.9 percent in 2019, down from 3.0 percent in 2018. The goods deficit decreased from $887.3 billion in 2018 to $…
U.S. International Trade in Goods and Services, December 2019
The U.S. monthly international trade deficit increased in December 2019 according to the U.S. Bureau of Economic Analysis and the U.S. Census Bureau. The deficit increased from $43.7 billion in November (revised) to $48.9 billion in December, as imports increased more than exports. The previously published November deficit was $43.1 billion. The goods deficit increased $5.1 billion in December to $69.7 billion. The services surplus decreased $0.…
Personal Income and Outlays, December 2019
Personal income increased 0.2 percent in December after increasing 0.4 percent in November. Wages and salaries, the largest component of personal income, increased 0.3 percent in December after increasing 0.4 percent in November.
Personal Income and Outlays, December 2019
Personal income increased 0.2 percent in December after increasing 0.4 percent in November. Wages and salaries, the largest component of personal income, increased 0.3 percent in December after increasing 0.4 percent in November.
GDP Increases in Fourth Quarter
Real gross domestic product (GDP) increased 2.1 percent in the fourth quarter of 2019, according to the “advance” estimate released by the Bureau of Economic Analysis. In the third quarter, real GDP also increased 2.1 percent. Fourth-quarter GDP highlights The fourth-quarter increase in real GDP reflected increases in consumer spending, government spending, housing investment, and exports which were partially offset by decreases in inventory…
Gross Domestic Product, Fourth Quarter and Year 2019 (Advance Estimate)
Real gross domestic product (GDP) increased 2.1 percent in the fourth quarter of 2019, according to the “advance” estimate released by the Bureau of Economic Analysis. In the third quarter, real GDP also increased 2.1 percent.
A New Look at U.S. Exporters and Importers of Services
New BEA research offers fresh insights into U.S. firms that export and import services internationally. The research article published recently in the Bureau of Economic Analysis’ Survey of Current Business focuses on firms that are engaged in the trade of “selected services,” a subset of international services trade statistics. BEA’s confidential international surveys gather extensive information on these selected services.
Gross Domestic Product by State: Third Quarter 2019
Real gross domestic product (GDP) increased in 49 states and the District of Columbia in the third quarter of 2019. The percent change in real GDP in the third quarter ranged from 4.0 percent in Texas to 0.0 percent in Delaware.
Gross Domestic Product by State, Third Quarter 2019
Real gross domestic product (GDP) increased in 49 states and the District of Columbia in the third quarter of 2019. The percent change in real GDP in the third quarter ranged from 4.0 percent in Texas to 0.0 percent in Delaware.
Gross Domestic Product by Industry: Third Quarter 2019
Nondurable goods manufacturing; retail trade; and professional, scientific, and technical services were the leading contributors to the increase in U.S. economic growth in the third quarter of 2019. Overall, 17 of 22 industry groups contributed to the 2.1 percent increase in real GDP in the third quarter.


