Bureau of Economic Analysis
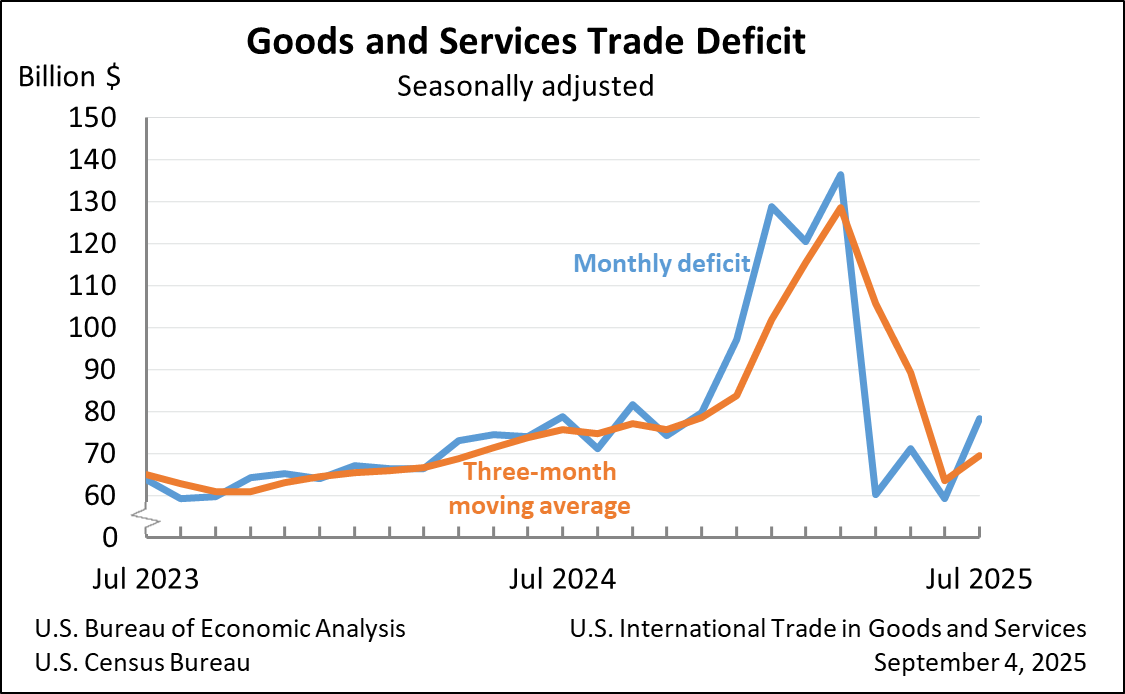
U.S. International Trade in Goods and Services, July 2025
The U.S. goods and services trade deficit increased in July 2025 according to the U.S. Bureau of Economic Analysis and the U.S. Census Bureau. The deficit increased from $59.1 billion in June (revised) to $78.3 billion in July, as imports increased more than exports. The goods deficit increased $18.2 billion in July to $103.9 billion. The services surplus decreased $1.1 billion in July to $25.6 billion.
Principal Federal Economic Indicators
Noteworthy
The Latest
GDP Increases in Second Quarter
Real gross domestic product (GDP) increased 2.0 percent in the second quarter of 2019, according to the “third” estimate released by the Bureau of Economic Analysis. The growth rate was the same as in the “second” estimate released in August. In the first quarter, real GDP rose 3.1 percent.
Gross Domestic Product, Second Quarter 2019 (Third Estimate); Corporate Profits, Second Quarter 2019 (Revised)
Real gross domestic product (GDP) increased 2.0 percent in the second quarter of 2019, according to the “third” estimate released by the Bureau of Economic Analysis. The growth rate was the same as in the “second” estimate released in August. In the first quarter, real GDP rose 3.1 percent.
State Personal Income, Second Quarter 2019
State personal income increased 5.4 percent at an annual rate in the second quarter of 2019, a deceleration from the 6.2 percent increase in the first quarter. The percent change in personal income across all states ranged from 7.5 percent in Texas to unchanged in North Dakota.
Prototype Stats Show Each State's Outdoor Recreation Economy
New prototype outdoor recreation statistics show state value added, compensation, and employment for all 50 states and the District of Columbia. These statistics show that the relative size of the outdoor recreation economy ranged from 5.4 percent of GDP for Hawaii to 1.2 percent for the District of Columbia in 2017.
Outdoor Recreation Satellite Account, U.S. and Prototype for States, 2017
The U.S. outdoor recreation economy accounted for 2.2 percent ($427.2 billion) of current-dollar gross domestic product (GDP) in 2017. The Outdoor Recreation Satellite Account (ORSA) also shows that inflation-adjusted (real) GDP for the outdoor recreation economy grew by 3.9 percent in 2017, faster than the 2.4 percent growth of the overall U.S. economy. Real gross output, compensation, and employment all grew faster in outdoor recreation than…
U.S. Current Account Deficit Narrows in Second Quarter 2019
The U.S. current account deficit, which reflects the combined balances on trade in goods and services and income flows between U.S. residents and residents of other countries, narrowed by $8.0 billion, or 5.9 percent, to $128.2 billion in the second quarter of 2019. The narrowing mainly reflected an expanded surplus on primary income. The second quarter deficit was 2.4 percent of current dollar gross domestic…
U.S. International Transactions, Second Quarter 2019
The U.S. current account deficit narrowed by $8.0 billion, or 5.9 percent, to $128.2 billion in the second quarter of 2019, according to statistics from the Bureau of Economic Analysis. The revised first quarter deficit was $136.2 billion. The second quarter deficit was 2.4 percent of current dollar gross domestic product, down from 2.6 percent in the first quarter.
Coming Soon: State Outdoor Recreation Statistics
BEA will release prototype statistics on Sept. 20 showing the role that outdoor recreation – pursuits like bicycling, RVing, and fishing – plays in each state’s economy. This will mark the first time state data are included in BEA’s outdoor recreation statistics.
An updated set of national outdoor recreation statistics will be released at the same time. Both the national and state data will cover 2012 through 2017.
BEA to Hold Sept. 10 Webinar on BE-140 Benchmark Survey of Insurance Services
BEA will conduct a webinar on Sept. 10 for those required to fill out the BE-140, a benchmark survey that collects information on insurance transactions between U.S. insurance companies and foreign persons.The one-hour webinar will start at 1 p.m. EDT and detail reporting requirements for the survey, which is due to the Bureau of Economic Analysis by Sept. 30.


